【版权声明】版权所有,严禁转载,严禁用于商业用途,侵权必究。
作者:厦门大学人工智能研究院2023级研究生 孔杭扬
指导老师:厦门大学数据库实验室 林子雨 博士/副教授
时间:2024年6月
相关教材:林子雨编著《Flink编程基础(Java版)》(访问教材官网)
相关案例:Flink大数据处理分析案例集锦
本案例采用一个常用的机器学习和数据挖掘领域的数据集——成人数据集。使用Python语言进行数据清洗,保存到分布式文件系统HDFS中,接下来使用PyFlink进行数据分析,最后,利用python的matplotlib库完成可视化工作。
数据集和代码下载:从百度网盘下载本案例的代码和数据集。(提取码是ziyu)
一、实验环境
本案例采用的实验环境为:Ubuntu22.04、Python3.10、PyFlink1.17.0、pandas、Matplotlib
二、实验过程
2.1 数据集收集与介绍
本次作业我使用了成人数据集(Adult dataset)是一个常用的机器学习和数据挖掘领域的数据集。该数据集可以在以下网址进行下载:https://www.kaggle.com/datasets/wenruliu/adult-income-dataset。 该数据集格式如下图所示:

该数据集包括以下14个特征:
1.年龄(Age): 以年为单位。
2.工作类型(Workclass): 描述工作类型,如私人企业、政府机构等。
3.收集人员编号(fnlwgt):编号。
4.教育水平(Education): 最高受教育程度。
5.教育年限(Education-Num): 受教育年限。
6.婚姻状况(Marital Status): 包括已婚、未婚、离异等。
7.职业(Occupation): 描述职业类型。
8.关系(Relationship): 与家庭成员的关系,如丈夫、妻子、子女等。
9.种族(Race): 种族信息。
10.性别(Sex): 性别。
11.资本收益(Capital Gain): 资本收益数量。
12.资本损失(Capital Loss): 资本损失数量。
13.每周工作小时数(Hours per week): 平均每周工作小时数。
14.原籍国(Native country): 出生国家或原籍国。
15.收入水平(Income): 目标变量,表示收入是否超过 50,000 美元/年。
2.2 数据集预处理
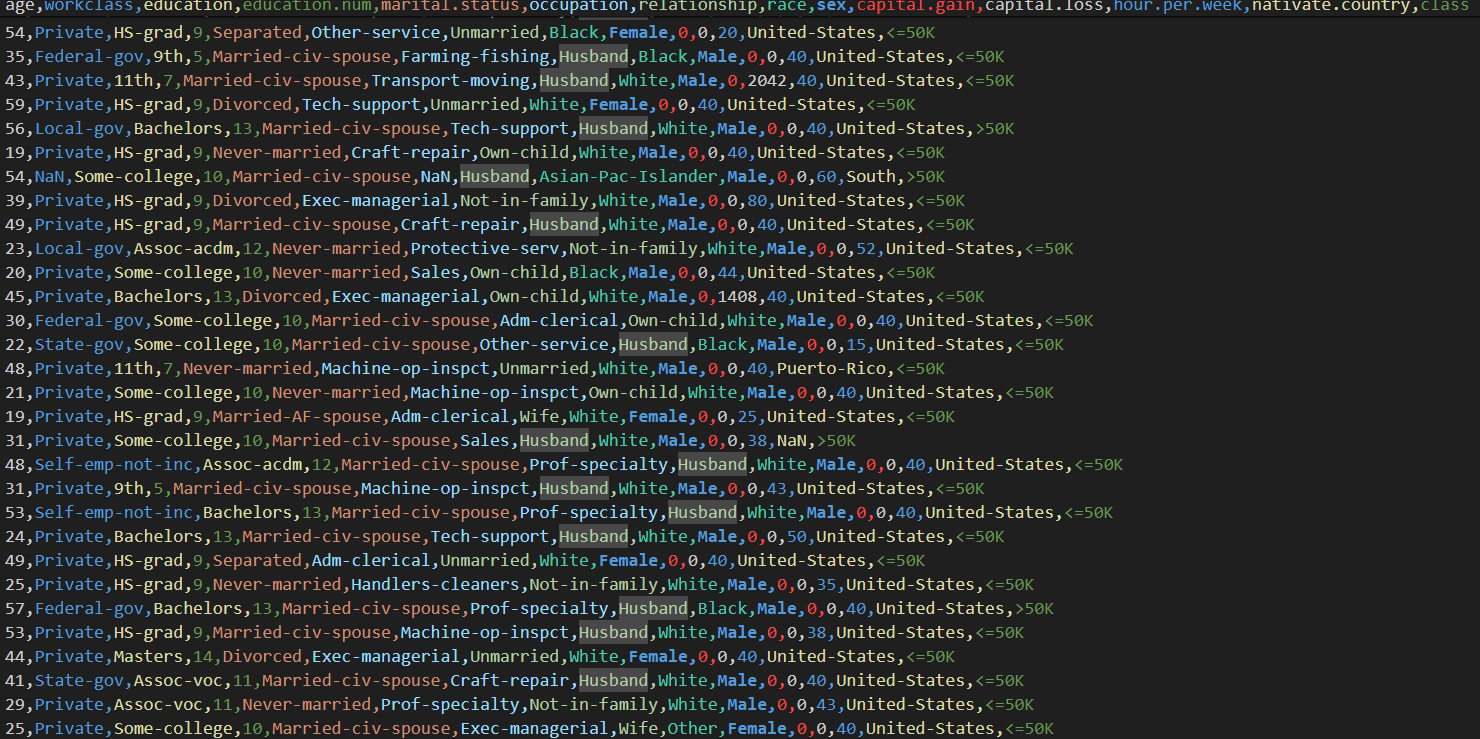
针对预处理部分,我们首先将数据通过python的pandas工具包读取为DataFrame格式,由于该数据中的列变量中存在部分无用变量,所以我们使用drop()命令删除收集人员这一列信息,随后由于数据存在缺失,我们使用replace()命令将空值统一填补为NaN(表示为空白值),由于人口数据集反应的是人口在国家中的比重,因此不能像以往的数据集一样删除重复信息。同时遍历 DataFrame中的每一列将字符串元素中的空格去除以方便接下来的统计操作。经过以上预处理后,我们将该数据存储为processed.csv文件,便于后续进行上传、处理。处理后的数据集如下图所示:
2.3 Flink数据处理
我们将第一步获得的两个文件上传至hdfs中,便于后续使用pyflink进行操作。

使用pyflink技术进行编程。使用:
1.StreamExecutionEnvironment.get_execution_environment()来获取流执行环境的实例。
2.env.set_parallelism(1)以单线程模式执行。
3.StreamTableEnvironment.create(env)基于之前创建的执行环境env创建一个表环境,用于创建和操作表
4.t_env.connect(FileSystem().path(path))等函数用于连接文件系统中的路径,并且以csv格式读取相应的数据
5.t_env.from_path()从临时表中获取表

根据年龄大小,将年龄段分为(15, 30), (30, 55), (55, 150)三个组,遍历每一个年龄组,利用flink的过滤功能山选取当前范围内的数据,创建一个csv格式的sink,将数据内容保存到csv文件内,以便后续的可视化操作。

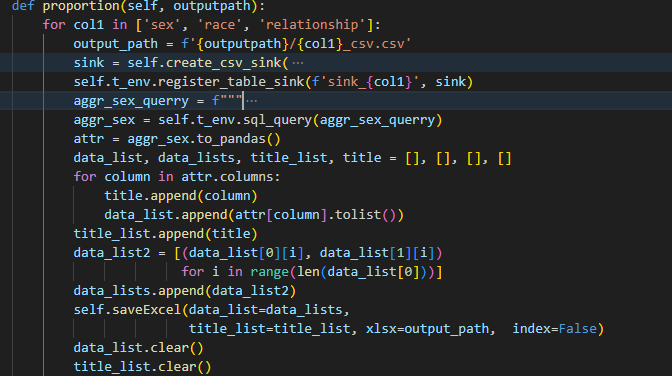
根据'sex', 'race', 'relationship'三个属性统计各个属性中,每一个元素占比。利用flink中的SQL接口命令,对表中的数据进行分组和计数,并将计数结果通过sink存储到csv中。
2.4 数据可视化
使用pandas统计'nativate.country'和'occupation'两个属性中出现的元素及其数量。选取出现次数最频繁的前1000种元素。设置词云相关的大小,颜色,字体等信息,使用matplotlib函数进行绘图。
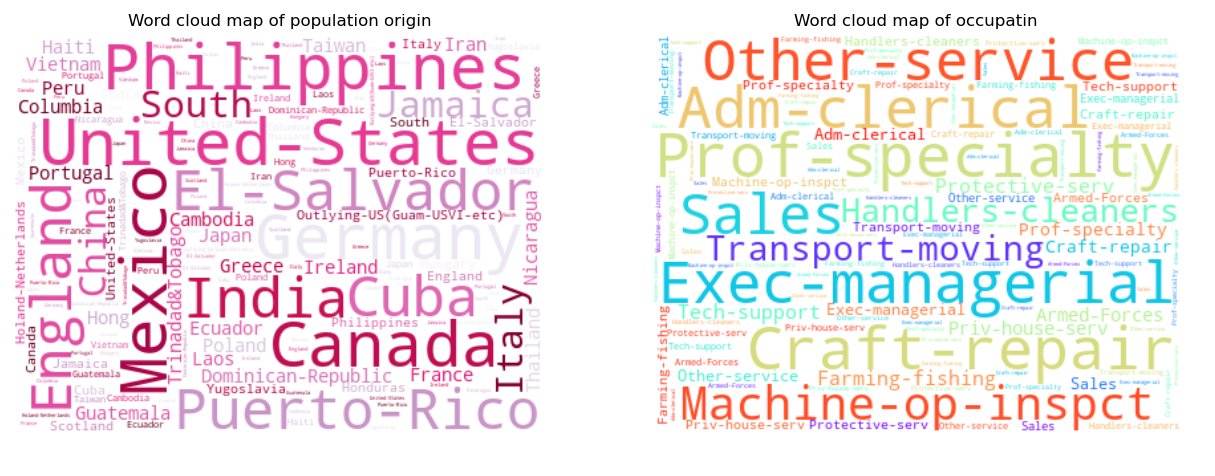
图7 国籍、工作词云图
使用pandas读取上一节中得到的"relationship"、"race"、"sex"元素的统计文件,由于保存的是二进制格式,因此先将其转化为xlsx,再通过openpyxlsx库读取文件内容。根据文件中的人数比例绘制扇形图,设置图片大小,扇形图的格式等内容,最后使用matplotlib函数进行绘图。

图8 家庭关系、人种、性别扇形图
使用pandas统计' education'属性中出现的元素及其数量。并绘制柱状图。
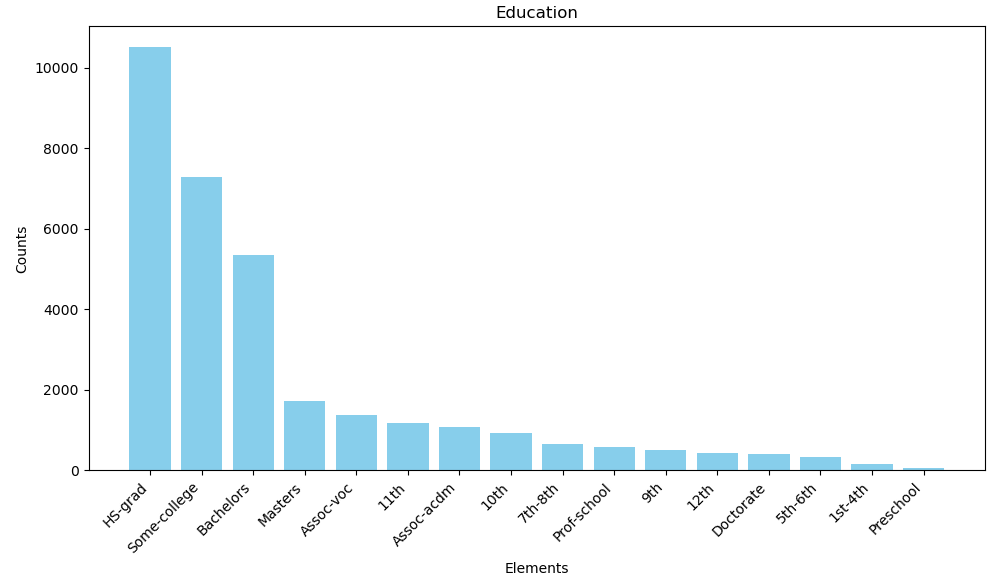
图9 学历统计柱状图
使用pandas读取上一节中得到的年龄段的统计文件内容,并且分别统计男女生的人数,在一张图中绘制条形图。
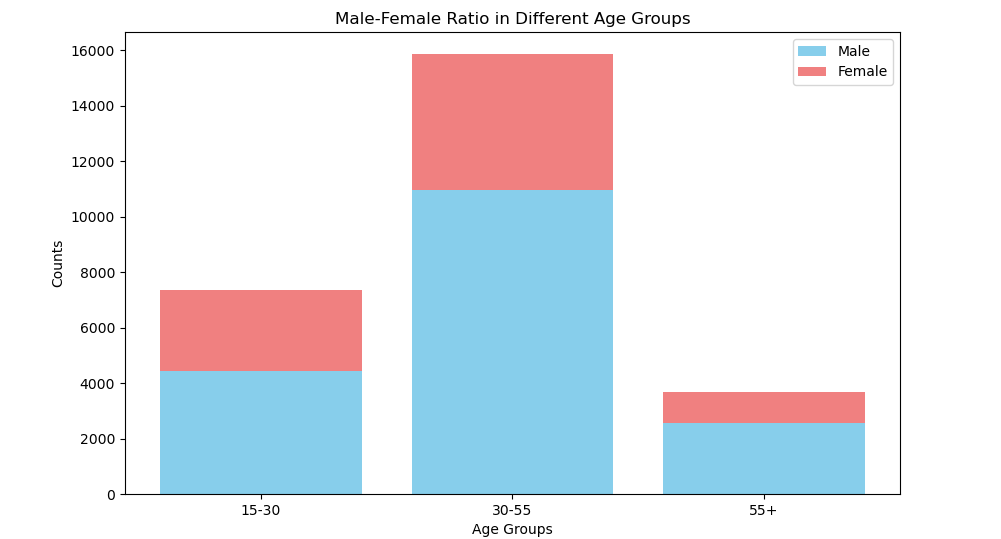
图10 不同年龄段男比例条形图
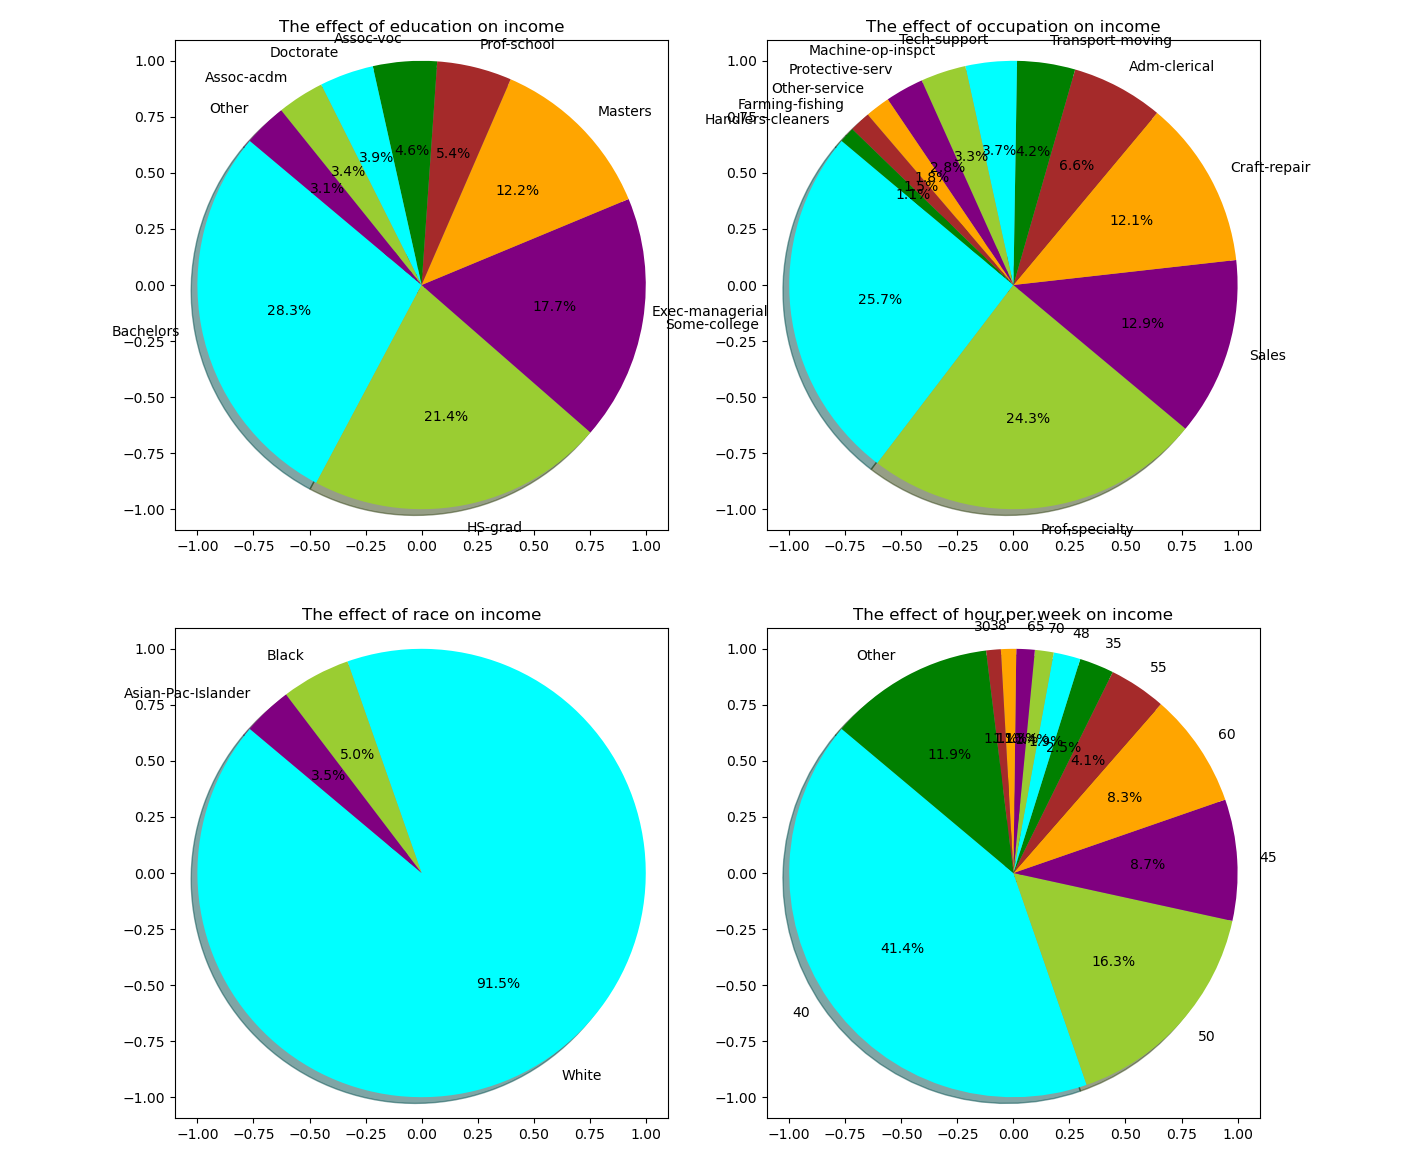
最后,未来展示年收入大于50k的人群中'education', 'occupation', 'race', 'hour.per.week'四种属性对收入影响,分别对上述四种属性进行可视化。
三、附录
预处理文件代码:
import pandas as pd
import numpy as np
import os
df = pd.read_csv('./数据集/adult.csv')
df.drop('fnlwgt', axis=1, inplace=True)
for i in df.columns:
    df[i].replace('?', 'NaN', inplace=True)
    for col in df.columns:
        if df[col].dtype != 'int64':
           df[col] = df[col].apply(lambda val: val.replace(" ", ""))
df.to_csv('processed.csv',index=False)
flink处理文件代码:
import os
import shutil
import traceback
import pandas as pd
from openpyxl import Workbook
from openpyxl.utils.dataframe import dataframe_to_rows
from openpyxl.styles import Border, Side
from openpyxl.utils import get_column_letter
from pyflink.datastream import StreamExecutionEnvironment
from pyflink.table import StreamTableEnvironment, CsvTableSink
from pyflink.table.descriptors import OldCsv, Schema, FileSystem
from pyflink.table import expressions as expr
from pyflink.table.expressions import lit, col
from pyflink.table.types import DataTypes
from pyflink.datastream.checkpointing_mode import CheckpointingMode

class py_flink:

    def __init__(self, path='processed.csv'):
        env = StreamExecutionEnvironment.get_execution_environment()
        env.set_parallelism(1)
        self.t_env = StreamTableEnvironment.create(env)
        self.t_env.connect(FileSystem().path(path)) \
            .with_format(OldCsv()
                         .ignore_first_line()
                         .field_delimiter(',')
                         .field('age', DataTypes.INT())
                         .field('workclass', DataTypes.STRING())
                         .field('education', DataTypes.STRING())
                         .field('education.num', DataTypes.INT())
                         .field('marital.status', DataTypes.STRING())
                         .field('occupation', DataTypes.STRING())
                         .field('relationship', DataTypes.STRING())
                         .field('race', DataTypes.STRING())
                         .field('sex', DataTypes.STRING())
                         .field('capital.gain', DataTypes.INT())
                         .field('capital.loss', DataTypes.INT())
                         .field('hour.per.week', DataTypes.INT())
                         .field('native.country', DataTypes.STRING())
                         .field('`class`', DataTypes.STRING())) \
            .with_schema(Schema()
                         .field('age', DataTypes.INT())
                         .field('workclass', DataTypes.STRING())
                         .field('education', DataTypes.STRING())
                         .field('education.num', DataTypes.INT())
                         .field('marital.status', DataTypes.STRING())
                         .field('occupation', DataTypes.STRING())
                         .field('relationship', DataTypes.STRING())
                         .field('race', DataTypes.STRING())
                         .field('sex', DataTypes.STRING())
                         .field('capital.gain', DataTypes.INT())
                         .field('capital.loss', DataTypes.INT())
                         .field('hour.per.week', DataTypes.INT())
                         .field('native.country', DataTypes.STRING())
                         .field('`class`', DataTypes.STRING())) \
            .create_temporary_table('source')

        self.ori_table = self.t_env.from_path('source')

    def saveExcel(self, data_list, title_list, xlsx, index):
        wb = Workbook()
        for sheet_index, data in enumerate(data_list):
            title = title_list[sheet_index]
            sheet_name = f'page_{sheet_index}'
            df = pd.DataFrame(data, columns=title)
            ws = wb.create_sheet(index=sheet_index)
            ws.title = sheet_name
            for r in dataframe_to_rows(df, index=index, header=True):
                ws.append(r)
            thin_border = Border(left=Side(style='thin'),
                                 right=Side(style='thin'),
                                 top=Side(style='thin'),
                                 bottom=Side(style='thin'))
            for row in ws.iter_rows():
                for cell in row:
                    cell.border = thin_border
            for column_cells in ws.columns:
                length = max(len(str(cell.value)) for cell in column_cells)
                ws.column_dimensions[get_column_letter(
                    column_cells[0].column)].width = length + 2

            for column_cells in ws.columns:
                length = max(len(str(cell.value)) for cell in column_cells)
                ws.column_dimensions[get_column_letter(
                    column_cells[0].column)].width = length + 2
        wb.save(xlsx)

    def is_path_exist(self, out_path):
        output_base_path = out_path
        if not os.path.exists(output_base_path):
            os.makedirs(output_base_path)
        for filename in os.listdir(output_base_path):
            file_path = os.path.join(output_base_path, filename)
            try:
                if os.path.isfile(file_path) or os.path.islink(file_path):
                    os.unlink(file_path)
                elif os.path.isdir(file_path):
                    shutil.rmtree(file_path)
            except Exception as e:
                print(f"Failed to delete {file_path}. Reason: {e}")

    def create_csv_sink(self, fields, data_types, path):
        return CsvTableSink(fields, data_types, path, ",", 1, False)

    def age_Meth(self, out_path):
        self.is_path_exist(out_path)
        age_groups = [(15, 30), (30, 55), (55, 150)]
        for i, (min_age, max_age) in enumerate(age_groups):
            filtered_table = self.ori_table.filter(
                self.ori_table.age >= min_age).filter(self.ori_table.age < max_age)
            if min_age < 55:
                output_path = f'{out_path}/age_{min_age}_{max_age}.csv'
            else:
                output_path = f'{out_path}/age_{min_age}+.csv'
            sink = self.create_csv_sink(
                ['age', 'workclass', 'education', 'education.num', 'marital.status',
                 'occupation', 'relationship', 'race', 'sex', 'capital.gain', 'capital.loss',
                 'hour.per.week', 'native.country', 'class'],
                [DataTypes.INT(), DataTypes.STRING(), DataTypes.STRING(), DataTypes.INT(),
                 DataTypes.STRING(), DataTypes.STRING(), DataTypes.STRING(), DataTypes.STRING(),
                 DataTypes.STRING(), DataTypes.INT(), DataTypes.INT(), DataTypes.INT(),
                 DataTypes.STRING(), DataTypes.STRING()],
                output_path
            )
            self.t_env.register_table_sink(f'sink_{i}', sink)
            try:
                filtered_table.execute_insert(f'sink_{i}').wait()
            except Exception as e:
                print(traceback.format_exc())
                print("Exception data:")
                print(filtered_table.fetch(5))
                continue

    def proportion(self, outputpath):
        for col1 in ['sex', 'race', 'relationship']:
            output_path = f'{outputpath}/{col1}_csv.csv'
            sink = self.create_csv_sink(
                [col1, 'count_num'],
                [DataTypes.STRING(), DataTypes.BIGINT()],
                output_path
            )
            self.t_env.register_table_sink(f'sink_{col1}', sink)
            aggr_sex_querry = f"""
                            SELECT
                            {col1},
                            COUNT(1) AS count_num
                            FROM `source`
                            GROUP BY {col1}
                            """
            aggr_sex = self.t_env.sql_query(aggr_sex_querry)
            attr = aggr_sex.to_pandas()
            data_list, data_lists, title_list, title = [], [], [], []
            for column in attr.columns:
                title.append(column)
                data_list.append(attr[column].tolist())
            title_list.append(title)
            data_list2 = [(data_list[0][i], data_list[1][i])
                          for i in range(len(data_list[0]))]
            data_lists.append(data_list2)
            self.saveExcel(data_list=data_lists,
                           title_list=title_list, xlsx=output_path,  index=False)
            data_list.clear()
            title_list.clear()

    def data_Meth(self, output='./'):
        self.age_Meth(output)
        self.proportion(output)
        self.t_env.execute('csv_processing_job')

if __name__ == "__main__":
    path = 'hdfs://localhost:9000/user/hadoop/input/processed.csv'
    pyjob = py_flink()
    pyjob.data_Meth()
可视化文件代码:
import pandas as pd
import matplotlib.pyplot as plt
import jieba
from collections import Counter
from wordcloud import WordCloud
import matplotlib.pyplot as plt
import numpy as np
import shutil
import os

'''
age:年龄
workclass 工作类型
fnlwgt 编号(抛弃)
education 受教育程度
education.num 受教育时间
marital.status 婚姻状况
occupation 职位
relationship 家庭关系
race 种族
sex 性别
capital.gain 资本收益
capital.loss 资本损失
hours.per.week 每周工作小时
native.country 原籍
class 收入阶层

'''

def Wordloud(df):
    words = []
    plt.figure(figsize=(10, 6))
    for comment in df['nativate.country']:
        if type(comment) == float:
            continue
        words += comment.split()
    word_count = Counter(words).most_common(1000)
    data_dict = {item[0]: item[1] for item in word_count}
    wordcloud = WordCloud(width=400, height=300, background_color='white', colormap='PuRd_r',
                          font_path=None, repeat=True).generate_from_frequencies(data_dict)
    plt.subplot(1, 2, 1)
    plt.imshow(wordcloud, interpolation='bilinear')
    plt.title('Word cloud map of population origin')
    plt.axis('off')
    words = []
    for comment in df['occupation']:
        if type(comment) == float:
            continue
        words += comment.split()
    word_count = Counter(words).most_common(1000)
    data_dict = {item[0]: item[1] for item in word_count}
    wordcloud = WordCloud(width=400, height=300, background_color='white', colormap='rainbow',
                          font_path=None, repeat=True).generate_from_frequencies(data_dict)
    plt.subplot(1, 2, 2)
    plt.imshow(wordcloud, interpolation='bilinear')
    plt.title('Word cloud map of occupatin')
    plt.axis('off')
    plt.show()

def Pie_Chart():
    plt.figure(figsize=(15, 5))
    plt.subplot(1, 3, 1)
    old_filename = "relationship_csv.csv"
    new_filename = "relationship.xlsx"
    if os.path.exists(new_filename):
        pass
    else:
        shutil.copyfile(old_filename, new_filename)
    data = pd.read_excel("relationship.xlsx", engine="openpyxl")
    colors = ['gold', 'yellowgreen', 'lightcoral',
              'lightskyblue', 'blue', 'green']
    plt.pie(data['count_num'], labels=data['relationship'], colors=colors,
            autopct='%1.1f%%', startangle=140)
    plt.title('Relationships in the family')
    plt.axis('equal')

    plt.subplot(1, 3, 2)
    old_filename = "race_csv.csv"
    new_filename = "race.xlsx"
    if os.path.exists(new_filename):
        pass
    else:
        shutil.copyfile(old_filename, new_filename)
    data = pd.read_excel("race.xlsx", engine="openpyxl")
    colors = ['gold', 'yellowgreen', 'lightcoral',
              'lightskyblue',  'green']
    plt.pie(data['count_num'], labels=data['race'], colors=colors,
            autopct='%1.1f%%', startangle=140)
    plt.title('race in the country')
    plt.axis('equal')

    plt.subplot(1, 3, 3)
    old_filename = "sex_csv.csv"
    new_filename = "sex.xlsx"
    if os.path.exists(new_filename):
        pass
    else:
        shutil.copyfile(old_filename, new_filename)
    data = pd.read_excel("sex.xlsx", engine="openpyxl")
    colors = ['gold', 'yellowgreen', 'lightcoral',
              'lightskyblue',  'green']
    plt.pie(data['count_num'], labels=data['sex'], colors=colors,
            autopct='%1.1f%%', startangle=140)
    plt.title('sex in the country')
    plt.axis('equal')
    plt.show()

def Education(df):
    element_count = df['education'].value_counts()
    elements = element_count.index.tolist()
    counts = element_count.values.tolist()
    plt.figure(figsize=(10, 6))
    plt.bar(elements, counts, color='skyblue')
    plt.xlabel('Elements')
    plt.ylabel('Counts')
    plt.title('Education')
    plt.xticks(rotation=45, ha='right')
    plt.tight_layout()
    plt.show()

def Age(df):
    male_counts = []
    female_counts = []
    name = ['age_15_30.csv', 'age_30_55.csv', 'age_55+.csv']
    for i in name:
        df = pd.read_csv(i, index_col=False, header=None)
        male_counts.append(len(df[df[8] == 'Male'].value_counts()))
        female_counts.append(len(df[df[8] == 'Female'].value_counts()))
    age_groups = ['15-30', '30-55', '55+']
    plt.figure(figsize=(10, 6))
    plt.bar(age_groups, male_counts, color='skyblue', label='Male')
    plt.bar(age_groups, female_counts, color='lightcoral',
            bottom=male_counts, label='Female')
    plt.xlabel('Age Groups')
    plt.ylabel('Counts')
    plt.title('Male-Female Ratio in Different Age Groups')
    plt.legend()
    plt.show()

def Income(df):
    plt.figure(figsize=(14, 14))
    class_ = df[df['class'] == '>50K']
    cause = ['education', 'occupation', 'race', 'hour.per.week']
    threshold = 0.01
    for i in range(len(cause)):
        column_counts = class_[cause[i]].value_counts()
        elements = column_counts.index.tolist()
        counts = column_counts.values.tolist()
        data = {elements[i]: counts[i] for i in range(len(elements))}
        other_count = sum(value for key, value in data.items()
                          if value/sum(counts) < threshold)
        data['Other'] = other_count
        data = {key: value for key, value in data.items() if value /
                sum(counts) >= threshold}
        colors = ['Cyan', 'yellowgreen', 'Purple',
                  'Orange', 'Brown', 'green']
        plt.subplot(2, 2, i+1)
        plt.pie(data.values(), labels=data.keys(), colors=colors, autopct='%1.1f%%',
                startangle=140, shadow=True,  frame=True)
        plt.title('The effect of {} on income'.format(cause[i]))
        plt.axis('equal')
    plt.show()

if __name__ == '__main__':
    df = pd.read_csv('./processed.csv', index_col=False)
    plt1 = Wordloud(df)
    plt2 = Pie_Chart()
    plt3 = Education(df)
    plt4 = Age(df)
    plt5 = Income(df)