【版权声明】版权所有,严禁转载,严禁用于商业用途,侵权必究。
作者:厦门大学人工智能研究院2023级研究生 杨宏林
指导老师:厦门大学数据库实验室 林子雨 博士/副教授
时间:2024年6月
相关教材:林子雨、郑海山、赖永炫编著《Spark编程基础(Python版,第2版)》(访问教材官网)
相关案例:基于Python语言的Spark数据处理分析案例集锦(PySpark)
数据集和代码下载:从百度网盘下载本案例数据集和代码。(提取码是ziyu)
一、实验环境
1.虚拟机环境:Linux Mint 21.3 Ubuntu-based Linux
2.Hadoop:version 3.3.5参考
3.Spark:version 3.2.0参考
4.Python:version 3.10.12
5.开发环境:vscode 1.89.1
6.Web框架:flask 3.0.3
7.可视化库:plotly 5.22.0
二、数据准备
2.1 数据集描述
数据集来自知名数据网站Kaggle,包含了从1996至2022共20多年来NBA球队名单上每一名球员的数据。它记录了年龄、身高、体重和出生地等人口统计学变量,以及球队效力、选秀和全年选秀等传记细节。此外,它还具有基本的盒式得分统计数据(basic box score stats,篮球术语:指记录比赛中球员的得分、篮板、助攻、抢断、盖帽等基本数据)。
包含如下共21个属性(列):
1.player_name:球员姓名
2.team_abbreviation:球员所效力的球队的缩写名称(赛季结束时)
3.age:球员的年龄
4.player_height:运动员的身高(cm)
5.player_weight:运动员的体重(kg)
6.college:球员就读的学院名称
7.country:球员出生的国家名称(不一定是国籍)
8.draft_year:球员被选中的年份
9.draft_round:选秀轮次,指球员被选中的轮次
10.draft_number:球员在选秀轮次中被选中的顺位
11.gp:球员在该赛季期间登场的比赛次数
12.pts:球员在该赛季的平均得分
13.reb:球员在该赛季的平均篮板
14.ast:球员在该赛季的平均助攻
15.net_rating:球队在球员上场时的每百回合的得分差
16.oreb_pct:球员在场上抢到的进攻篮板的比例
17.dreb_pct:球员在场上抢到的防守篮板的比例
18.usg_pct:球员在场上使用的团队进攻次数百分比(投篮出手次数+罚球次数+失误次数)/ 回合数)
19.ts_pct:球员的真实命中率,考虑了罚球、两分球和三分球。
20.ast_pct:球员在场上时助攻的队友投篮百分比
21.season:NBA赛季
2.2 数据预处理
数据概览
import pandas as pd
import numpy as np

df = pd.read_csv('data/all_seasons.csv', index_col=0)
country_codes = pd.read_csv("data/all_seasons.csv", index_col=0)
df.head()
df.info()
df.describe()
categoricals = df.select_dtypes(exclude=[np.number])
categoricals.describe()
数据处理
1.使用boolean逻辑创建drafted列,表明是否为选秀球员
df['drafted'] = np.where(df['draft_year'] != 'Undrafted', 1, 0)2.将draft_year列转换为日期类型
# Replace Undrafted with NaN
df['draft_year'] = df['draft_year'].replace(r'Undrafted', np.nan, regex=True)
# Convert the column data type to date
df['draft_year'] = pd.to_datetime(df['draft_year'])
3.将season列转换为日期类型
df['season'] = pd.to_datetime(df['season'].str[:4])4.标准化country
 df['country'] = df['country'].replace({
    'Great Britain':'United Kingdom',
    'England':'United Kingdom',
    'Scotland':'United Kingdom',
    'Bosnia & Herzegovina':'Bosnia and Herzegovina',
    'Bosnia':'Bosnia and Herzegovina',
    'Cabo Verde':'Cape Verde',
    'St. Vincent & Grenadines':'Saint Vincent and Grenadines'})
数据转换
df.to_csv('data/all_seasons_processed.csv')2.3 数据集上传
1.启用Hadoop中的HDFS框架(确保Hadoop已安装)
/usr/local/hadoop/sbin/start-dfs.sh2.登录用户创建目录及data子目录
/usr/local/hadoop/bin/hdfs dfs -mkdir -p /user/hadoop
/usr/local/hadoop/bin/hdfs dfs -mkdir -p data
3.把本地文件系统中的数据集all_season_processed.csv上传到分布式文件系统中
cd nbaPlayerDataAnalysis
/usr/local/hadoop/bin/hdfs dfs -put ./data/all_season_processed.csv data
三、项目框架与整体逻辑
3.1 项目框架
nbaPlayerDataAnalysis
- data_pre-processing.ipynb
- main.py
- plot_html.py
- flash_start.py
--data- all_season.csv
- all_season_processed.csv
--json_output
--templates3.2 整体逻辑
1.原始数据集保存在data文件夹下,进行数据概览与数据预处理: data_pre-processing.ipynb。
2.上传数据至HDFS后,将数据处理分析主程序:main.py提交到Spark,返回并保存结果为JSON文件;从HDFS将其取回至本地,放在json_ouput文件夹下。
3.基于JSON数据,本地(或提交到Spark)运行plot.html.py,实现交互式数据可视化,并保存对应结果为HTML文件,放在templates文件夹下。
本地(或提交到Spark)运行flask_start.py,搭建Web框架,方便在网页上进行交互式数据可视化。四、基于Spark的数据分析
4.1 数据分析问题设计
1.球员的年龄如何影响他们的场均得分、助攻和篮板
2.球员身高、体重、场均助攻和场均篮板之间的相关性变化
3.国际球员(非美国)占比随时间的变化
4.球员平均身高和年龄变化
5.不同选秀顺位球员上场百回合得分统计图
6.不同大学培养的球员在NBA的平均得分、助攻和篮板表现
7.NBA总得分、总篮板和总助攻排名前50的大学
4.2 数据分析问题实现
main.py文件如下:
from pyspark.sql import SparkSession
from pyspark.sql.functions import avg, col, corr, count, sum, when
from functools import wraps

def save_results(output_path):
    """
    Decorator to save DataFrame results to a specified JSON path.
    """

    def decorator(func):
        @wraps(func)
        def wrapper(*args, **kwargs):
            # Call the data processing function
            df = func(*args, **kwargs)
            # Save the DataFrame results as a single JSON file by coalescing.
            df.write.json(output_path, mode='overwrite')
            return df

        return wrapper

    return decorator

def create_spark_session():
    """
    Create a Spark session configured for using PySpark.
    """
    return SparkSession.builder \
        .appName("NBA Player Analysis") \
        .getOrCreate()

def load_data(spark, file_path):
    """
    Load data from HDFS into a Spark DataFrame.
    """
    return spark.read.csv(file_path, header=True, inferSchema=True)

@save_results("json_output/player_performance_by_age")
def analyze_player_performance_by_age(df):
    """
    Analyze how players' ages affect their average points, assists, and rebounds per game.
    """
    # Select relevant columns and convert to proper types if necessary
    result_df = df.select(
        col('age').cast('integer'),
        col('pts').cast('float'),
        col('ast').cast('float'),
        col('reb').cast('float')
    )

    # Group by age and calculate average points, assists, and rebounds
    age_analysis = result_df.groupBy('age').agg(
        avg('pts').alias('avg_points'),
        avg('ast').alias('avg_assists'),
        avg('reb').alias('avg_rebounds')
    ).orderBy('age')
    return age_analysis

@save_results("json_output/correlations_over_time")
def analyze_correlations_over_time(df):
    """
    Analyze the correlations between height, weight, average assists,
    and average rebounds for each season.
    """
    # Select necessary columns and cast to appropriate data types
    correlations_df = df.select(
        col('season'),
        col('player_height').cast('float'),
        col('player_weight').cast('float'),
        col('ast').cast('float').alias('average_assists'),
        col('reb').cast('float').alias('average_rebounds')
    )

    # Calculate correlations for each season
    correlation_results = correlations_df.groupBy('season').agg(
        corr('player_height', 'average_rebounds').alias('height_rebounds_corr'),
        corr('player_height', 'average_assists').alias('height_assists_corr'),
        corr('player_weight', 'average_rebounds').alias('weight_rebounds_corr'),
        corr('player_weight', 'average_assists').alias('weight_assists_corr')
    ).orderBy('season')

    return correlation_results

@save_results("json_output/performance_by_university")
def analyze_performance_by_university(df):
    """
    Analyze average scoring, assist, and rebound performance of players trained by different universities.
    """
    # Select necessary columns and ensure proper data types
    university_performance_df = df.select(
        col('college').alias('university'),
        col('pts').cast('float').alias('points'),
        col('ast').cast('float').alias('assists'),
        col('reb').cast('float').alias('rebounds')
    )

    # Group by university and calculate average points, assists, and rebounds
    result_df = university_performance_df.groupBy('university').agg(
        avg('points').alias('avg_points'),
        avg('assists').alias('avg_assists'),
        avg('rebounds').alias('avg_rebounds')
    ).orderBy('university')

    return result_df

@save_results("json_output/net_rating_by_draft_number")
def analyze_net_rating_by_draft_number(df):
    """
    Analyze the 'net rating' differences for different 'draft numbers'.
    """
    # Ensure proper data types
    draft_net_rating_df = df.select(
        col('draft_number').cast('integer'),
        col('net_rating').cast('float')
    )

    # Group by draft number and calculate average net rating
    result_df = draft_net_rating_df.groupBy('draft_number').agg(
        avg('net_rating').alias('avg_net_rating')
    ).orderBy('draft_number')

    return result_df

@save_results("json_output/non_usa_players_proportion_by_season.json")
def analyze_non_usa_players_proportion_by_season(df):
    """
    Analyze the proportion of non-USA players changes with season.
    """
    # Filter and create a column 'is_non_usa' to indicate non-USA players
    non_usa_df = df.withColumn(
        'is_non_usa', when(col('country') != 'USA', 1).otherwise(0)
    )

    # Group by season, count total players and non-USA players
    season_stats = non_usa_df.groupBy('season').agg(
        count('*').alias('total_players'),
        sum('is_non_usa').alias('non_usa_players')
    )

    # Calculate the proportion of non-USA players per season
    proportion_df = season_stats.withColumn(
        'non_usa_proportion', col('non_usa_players') / col('total_players')
    ).select('season', 'non_usa_proportion').orderBy('season')

    return proportion_df

@save_results("json_output/height_age_by_season")
def analyze_height_age_by_season(df):
    """
    Analyze the average height and age of players, grouped by season.
    """
    # Calculate the average height and age grouped by season
    result_df = df.groupBy('season').agg(
        avg('player_height').alias('avg_height'),
        avg('age').alias('avg_age')
    ).orderBy('season')

    return result_df

@save_results("json_output/top_colleges_by_stats")
def analyze_top_colleges_by_stats(df):
    """
    Analyze top 50 colleges by total points, rebounds, and assists.
    """
    # Group by college and calculate total points, rebounds, and assists
    stats_df = df.groupBy('college').agg(
        sum('pts').alias('total_points'),
        sum('reb').alias('total_rebounds'),
        sum('ast').alias('total_assists')
    )

    # Get top 50 for each category
    top_points = stats_df.sort(stats_df.total_points.desc()).limit(50)
    top_rebounds = stats_df.sort(stats_df.total_rebounds.desc()).limit(50)
    top_assists = stats_df.sort(stats_df.total_assists.desc()).limit(50)

    # Combine results into one DataFrame for export
    top_colleges = top_points.union(top_rebounds).union(top_assists).distinct()
    return top_colleges

def main():
    # Initialize Spark Session
    spark = create_spark_session()

    # Load data from HDFS
    data_path: str = "data/all_seasons_processed.csv"  # Update this path
    df = load_data(spark, data_path)

    # Perform data analysis
    analyze_player_performance_by_age(df)
    analyze_correlations_over_time(df)
    analyze_performance_by_university(df)
    analyze_net_rating_by_draft_number(df)
    analyze_non_usa_players_proportion_by_season(df)
    analyze_height_age_by_season(df)
    analyze_top_colleges_by_stats(df)

    # Stop the Spark session
    spark.stop()

if __name__ == "__main__":
    main()
4.3 代码运行与结果取回
在运行Hadoop框架前提下,在命令行运行:
/usr/local/spark/bin/spark-submit --master local /home/hadoop/Desktop/nbaPlayerDataAnalysis/main.py运行成功后取回数据至本地,删除HDFS上结果:
/usr/local/hadoop/bin/hdfs dfs -get json_output ./json_output
/usr/local/hadoop/bin/hdfs dfs -rm -r json*
本地json_output结构

--json_output
--correlations_over_time
- _SUCCESSS
- part*.json
...五、数据可视化实现
交互式数据的可视化选用的是Python的第三方库,plotly。从json_output文件夹中读取JSON数据,从而进行可视化编程,将结果直接保存为templates文件夹下HTML文件。
plot_html.py文件如下:
Trick:这里根据4.3中取回的json_output结构,定义一个正则表达式函数遍历读取给定目录下的JSON文件。import os import re import pandas as pd import plotly.graph_objects as go import plotly.express as px from typing import List
def read_files_from_directory(directory, pattern):
使用正则表达式编译模式
regex_pattern = re.compile(pattern)

# 存储匹配到的文件路径
matched_files = []

# 遍历目录中的文件和文件夹
for root, dirs, files in os.walk(directory):
    for file in files:
        # 使用正则表达式模式匹配文件名
        if regex_pattern.match(file):
            # 构造文件的完整路径
            file_path = os.path.join(root, file)
            matched_files.append(file_path)

return matched_files
def draw_player_performance_by_age(path):
matched_json: List = read_files_from_directory(path, r'part.*.json')
df_age = pd.read_json(matched_json[0], lines=True)
Create the figure with dropdowns for different metrics
fig = go.Figure()

# Add traces for points, assists, rebounds
fig.add_trace(go.Scatter(x=df_age['age'], y=df_age['avg_points'], visible=True, name='Average Points'))
fig.add_trace(go.Scatter(x=df_age['age'], y=df_age['avg_assists'], visible=False, name='Average Assists'))
fig.add_trace(go.Scatter(x=df_age['age'], y=df_age['avg_rebounds'], visible=False, name='Average Rebounds'))

# Create dropdowns
fig.update_layout(
    updatemenus=[
        dict(
            buttons=list([
                dict(label="Points",
                     method="update",
                     args=[{"visible": [True, False, False]},
                           {"title": "Average Points by Age"}]),
                dict(label="Assists",
                     method="update",
                     args=[{"visible": [False, True, False]},
                           {"title": "Average Assists by Age"}]),
                dict(label="Rebounds",
                     method="update",
                     args=[{"visible": [False, False, True]},
                           {"title": "Average Rebounds by Age"}])
            ]),
            direction="down",
            # pad={"r": 10, "t": 10},
            showactive=True,
            x=0.1,
            xanchor="center",
            y=1.15,
            yanchor="top"
        ),
    ],
    title="Player Performance by Age",
    xaxis_title="Age",
    yaxis_title="Metric Value",
    template='plotly_dark',
)

# Save the figure as an HTML file
fig.write_html('templates/player_performance_by_age.html')
def draw_top_colleges_by_stats(path):
matched_json: List = read_files_from_directory(path, r'part.*.json')
df_colleges = pd.read_json(matched_json[0], lines=True)
Separate dataframes for points, rebounds, and assists
df_points = df_colleges.nlargest(50, 'total_points')
df_rebounds = df_colleges.nlargest(50, 'total_rebounds')
df_assists = df_colleges.nlargest(50, 'total_assists')

fig = go.Figure()
fig.add_trace(go.Bar(x=df_points['college'], y=df_points['total_points'], text=df_points['total_points'],
                     textposition='auto', visible=True, name='Total Points', texttemplate='%{text:.4s}'))
fig.add_trace(go.Bar(x=df_rebounds['college'], y=df_rebounds['total_rebounds'], text=df_rebounds['total_rebounds'],
                     textposition='auto', visible=False, name='Total Rebounds', texttemplate='%{text:.4s}'))
fig.add_trace(go.Bar(x=df_assists['college'], y=df_assists['total_assists'], text=df_assists['total_assists'],
                     textposition='auto', visible=False, name='Total Assists', texttemplate='%{text:.4s}'))
fig.update_layout(
    updatemenus=[
        dict(
            buttons=list([
                dict(label="Total Points",
                     method="update",
                     args=[{"visible": [True, False, False]},
                           {"title": "Top 50 Colleges by Total Points"}]),
                dict(label="Total Rebounds",
                     method="update",
                     args=[{"visible": [False, True, False]},
                           {"title": "Top 50 Colleges by Total Rebounds"}]),
                dict(label="Total Assists",
                     method="update",
                     args=[{"visible": [False, False, True]},
                           {"title": "Top 50 Colleges by Total Assists"}])
            ]),
            direction="down",
            showactive=True,
            x=0.5,
            xanchor="center",
            y=1.1,
            yanchor="top"
        ),
    ],
    title="Top 50 Colleges by Total Performance",
    xaxis_title="College",
    yaxis_title="Metric",
    template='plotly_dark'
)
fig.write_html('templates/top_colleges_by_stats.html')
def draw_net_rating_by_draft_number(path):
matched_json: List = read_files_from_directory(path, r'part.*.json')
df_draft = pd.read_json(matched_json[0], lines=True)
Create a bar chart
fig = px.bar(df_draft, x='draft_number', y='avg_net_rating', title='Average Net Rating by Draft Number',
             labels={'draft_number': 'Draft Number', 'avg_net_rating': 'Average Net Rating'},
             template='plotly_dark')

# Save the figure as an HTML file
fig.write_html('templates/net_rating_by_draft_number.html')
def draw_correlations_over_time(path):
matched_json: List = read_files_from_directory(path, r'part.*.json')
df_correlations = pd.read_json(matched_json[0], lines=True)
fig = go.Figure()
fig.add_trace(go.Scatter(x=df_correlations['season'], y=df_correlations['height_rebounds_corr'], mode='lines',
name='Height-Rebounds Correlation'))
fig.add_trace(go.Scatter(x=df_correlations['season'], y=df_correlations['height_assists_corr'], mode='lines',
name='Height-Assists Correlation'))
fig.add_trace(go.Scatter(x=df_correlations['season'], y=df_correlations['weight_rebounds_corr'], mode='lines',
name='Weight-Rebounds Correlation'))
fig.add_trace(go.Scatter(x=df_correlations['season'], y=df_correlations['weight_assists_corr'], mode='lines',
name='Weight-Assists Correlation'))
fig.update_layout(
title='Correlation Coefficient Comparison Over Time',
xaxis_title='Season',
yaxis_title='Coefficient',
plot_bgcolor='rgba(0,0,0,0)',
template='plotly_dark',
)
# Save the figure
fig.write_html('templates/correlations_over_time.html')
def draw_non_usa_players_proportion_by_season(path):
matched_json: List = read_files_from_directory(path, r'part.*.json')
json_data = pd.read_json(matched_json[0], lines=True)
Create a line plot
fig = px.line(json_data, x='season', y='non_usa_proportion', title='Proportion of Non-USA Players Over Seasons',
              labels={'season': 'Season', 'non_usa_proportion': 'Proportion of Non-USA Players'})

# Improve the visual style
fig.update_layout(
    xaxis_title='Season',
    yaxis_title='Proportion',
    legend_title='Legend',
    template='plotly_dark',  # Using a dark theme for better visual contrast
)

# Save the figure as an HTML file
fig.write_html('templates/non_usa_players_proportion_by_season.html')
def draw_performance_by_university(path):
matched_json: List = read_files_from_directory(path, r'part.*.json')
df_uni = pd.read_json(matched_json[0], lines=True)
Scatter plot for universities
fig = px.scatter(df_uni, x='university', y='avg_points', color='avg_rebounds',
                 size='avg_assists', hover_data=['university'],
                 title='Performance by University',
                 labels={'university': 'University', 'avg_points': 'Average Points'})

# Save the figure as an HTML file
fig.write_html('templates/performance_by_university.html')
def draw_height_age_by_season(path):
matched_json: List = read_files_from_directory(path, r'part.*.json')
df_season_stats = pd.read_json(matched_json[0], lines=True)
Create the figure with subplots
fig = go.Figure()

# Add traces for average height and average age
fig.add_trace(
    go.Scatter(x=df_season_stats['season'], y=df_season_stats['avg_height'], name='Average Height (cm)', yaxis='y1')
)
fig.add_trace(
    go.Scatter(x=df_season_stats['season'], y=df_season_stats['avg_age'], name='Average Age (years)', yaxis='y2')
)

# Create axis objects
fig.update_layout(
    xaxis=dict(title='Season'),
    yaxis=dict(title='Average Height (cm)', side='left',
               range=[min(df_season_stats['avg_height']) - 1, max(df_season_stats['avg_height']) + 1]),
    yaxis2=dict(title='Average Age (years)', overlaying='y', side='right',
                range=[min(df_season_stats['avg_age']) - 1, max(df_season_stats['avg_age']) + 1]),
    title="Average Height and Age of NBA Players by Season",
    template='plotly_dark'
)

# Save the figure as an HTML file
fig.write_html('templates/average_height_age_by_season.html')
def main():
if not os.path.exists('templates'):
os.makedirs('templates')
draw_player_performance_by_age("json_output/player_performance_by_age")
draw_correlations_over_time("json_output/correlations_over_time")
draw_performance_by_university("json_output/performance_by_university")
draw_net_rating_by_draft_number("json_output/net_rating_by_draft_number")
draw_non_usa_players_proportion_by_season("json_output/non_usa_players_proportion_by_season")
draw_height_age_by_season("json_output/height_age_by_season")
draw_top_colleges_by_stats("json_output/top_colleges_by_stats")
if name == 'main':
main()
# 六、Web本地服务器部署
## 6.1 框架搭建
基于flask框架,可以将程序快速部署。
新建一个index.html作为默认界面,并存放在templates目录下,方便flask接口检测。
```html
<!DOCTYPE html>
<html lang="en">

<head>
    <meta charset="UTF-8">
    <meta name="viewport" content="width=device-width, initial-scale=1.0">
    <meta http-equiv="X-UA-Compatible" content="ie=edge">
    <title>NBA Players Data</title>
</head>

<body>
    <h2>NBA players 1996-2022 多赛季数据分析</h2>
    <ul style="line-height: 2em">
        <li><a href="non_usa_players_proportion_by_season.html">国际球员(非美国)占比变化统计图</a></li>
        <li><a href="average_height_age_by_season.html">球员平均身高和年龄变化统计图</a></li>
        <li><a href="correlations_over_time.html">球员身高和体重与平均篮板、平均助攻相关性统计图</a></li>
        <li><a href="net_rating_by_draft_number.html">不同选秀顺位球员上场百回合得分统计图</a></li>
        <li><a href="performance_by_university.html">不同大学出身球员平均得分、助攻和篮板表现</a></li>
        <li><a href="player_performance_by_age.html">球员场均得分、助攻和篮板随年龄变化统计图</a></li>
        <li><a href="top_colleges_by_stats.html">NBA总得分、总篮板和总助攻排名前50的大学</a></li>

    </ul>
</body>
</html>
flask_start.py编写如下:
from flask import Flask
from flask import render_template

app = Flask(__name__)

@app.route('/')
def index():
    # 使用 render_template() 方法来渲染模板
    return render_template('index.html')

@app.route('/<filename>')
def req_file(filename):
    return render_template(filename)

if __name__ == '__main__':
    app.debug = False
    app.run()
命令行运行该文件:
python3 /home/hadoop/Desktop/nbaPlayerDataAnalysis/flask_start.py或在IDE中直接运行:

6.2 结果展示
运行flask_start.py后,浏览器输入命令行提示的URL(这里为默认的5000端口):
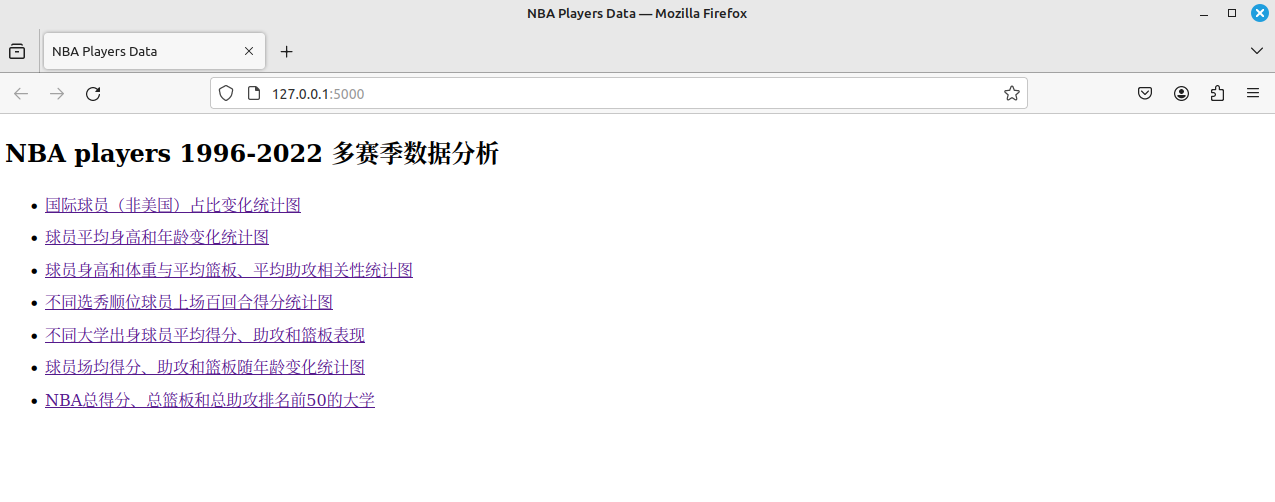
球员场均得分、助攻和篮板随年龄变化统计:
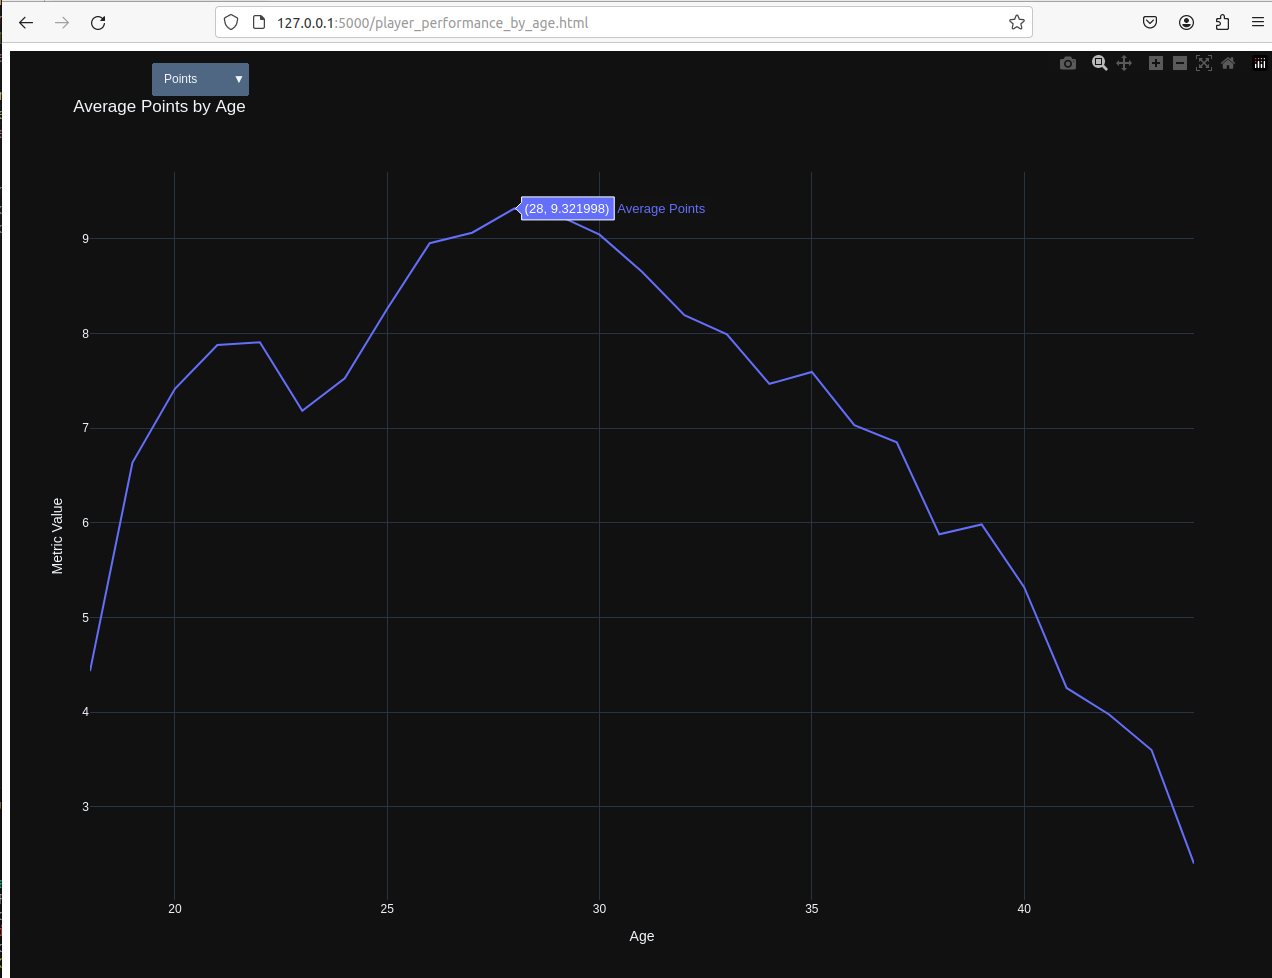
NBA球员大概在29~31之间进入生涯数据巅峰期,无论是得分、篮板还是助攻(这里仅展示最能表现的得分,助攻情况略有不同,高位值可持续至35岁左右)
球员身高、体重和场均助攻、场均篮板之间的相关性变化:
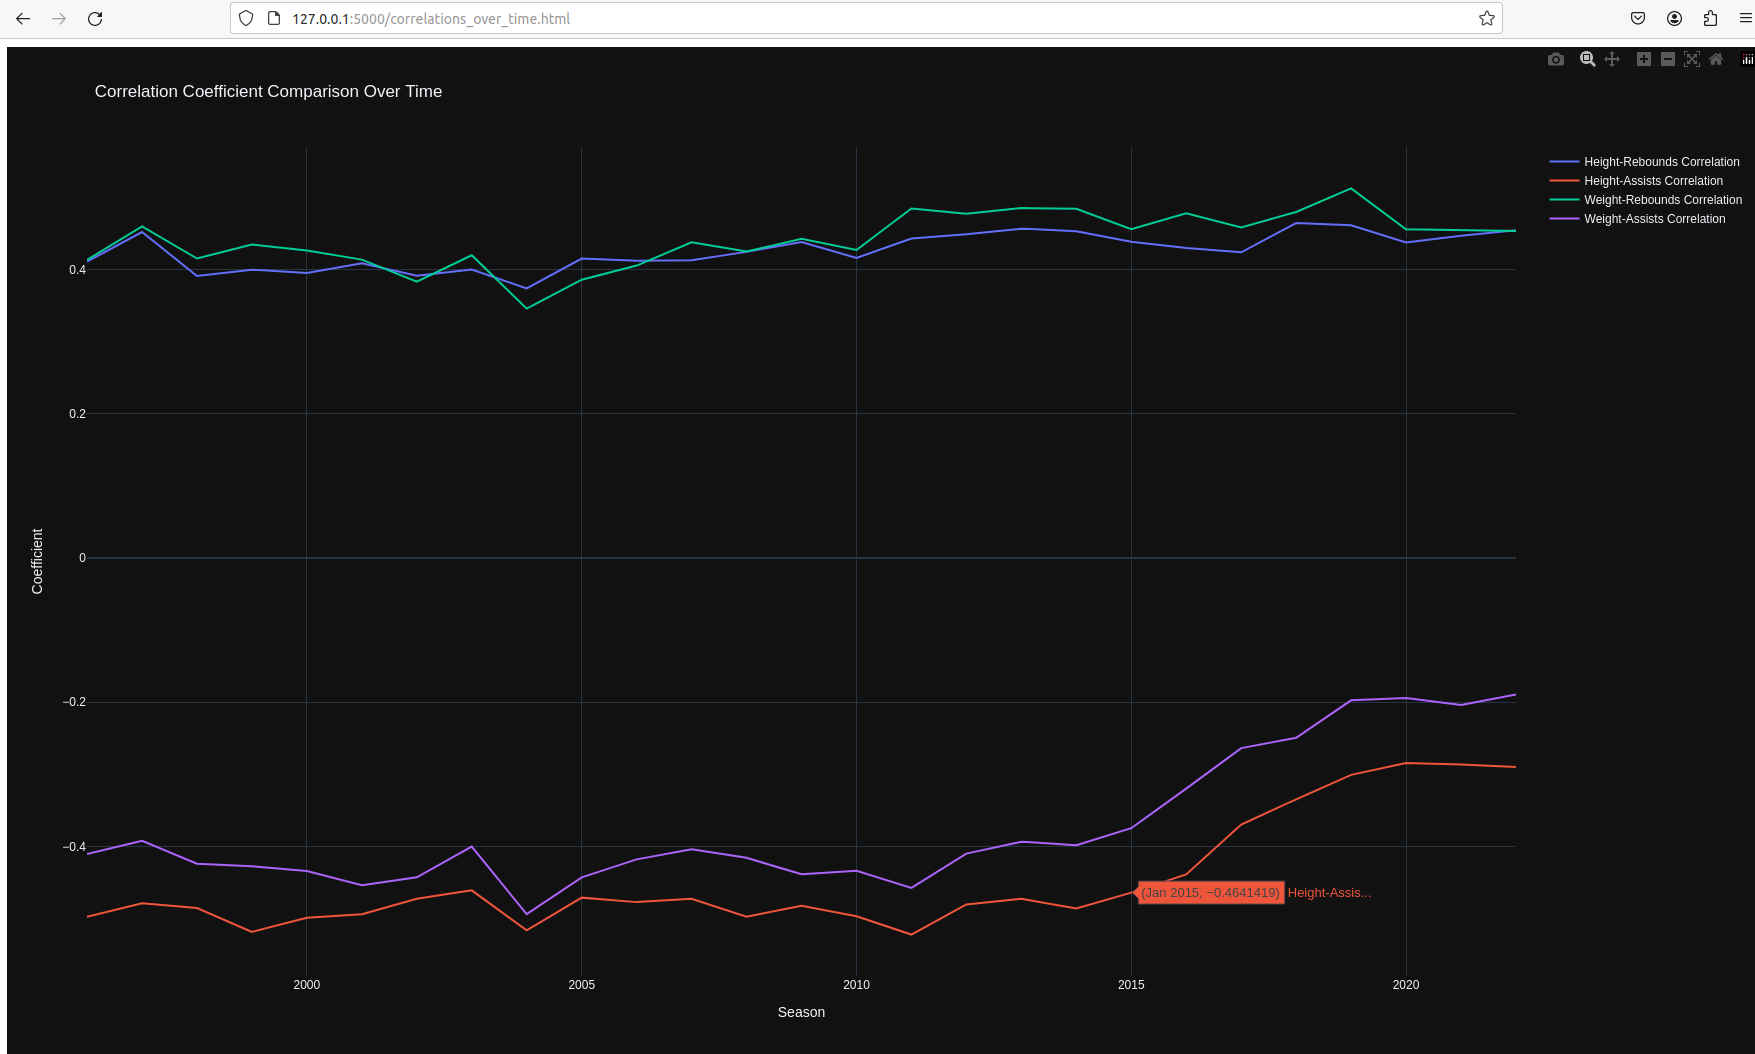
篮板球和身高、体重的相关系数基本上没有明显变化,维持在较高水准且保持稳定,说明身高和体重在篮板球争抢上一直具有重要作用;
然而,自2014~2015年左右,助攻和身高、体重的负相关正在逐步减少,说明比赛方式正在发生改变,大个子球员在球队承担的作用不再局限于“Dirty work”[防守、篮板],已经成为球队整体组织进攻的重要一环。
--数据之外--:近5年NBA的MVP获得者均为大个子球员[PF or C],并且除Joel Embiid外,场均助攻均在5次以上
国际球员(非美国)占比随时间的变化:
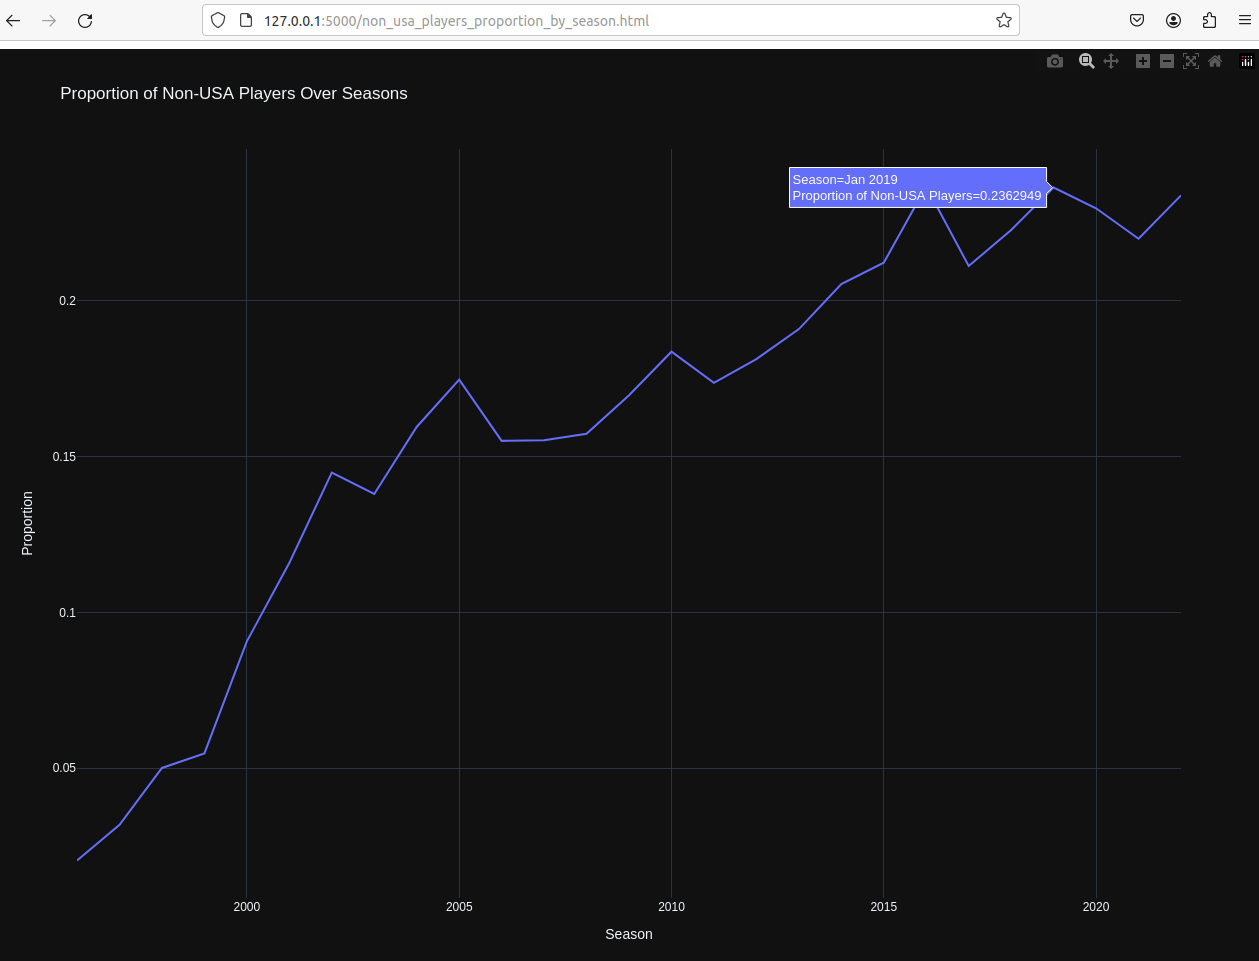
20几年间,国际球员在联盟中的占比稳步上升,国际化十分成功。 --数据之外--:近5年NBA的MVP获得者均为国际球员
球员平均身高和年龄变化:
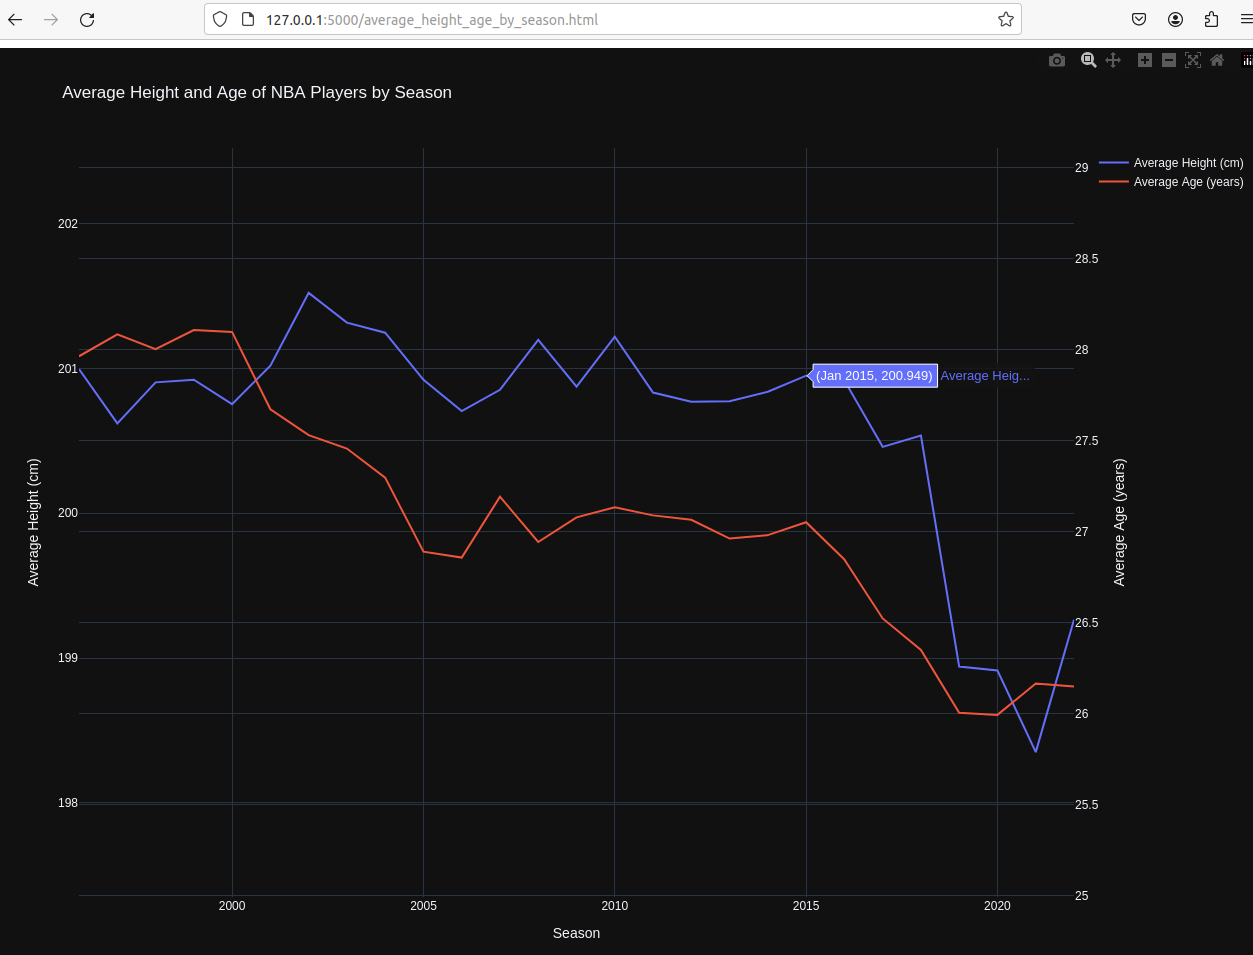
小球化:在2014-2015左右,联盟对“高个”的追求下降,勇士队正式掀起小球时代风暴;
年轻化:同样从2014年左右开始,年轻人开始逐渐走向舞台,猜想可能是小球时代节奏加快,回合数变多,年轻人更加具有优势。
不同选秀顺位球员上场球队百回合净胜分统计:
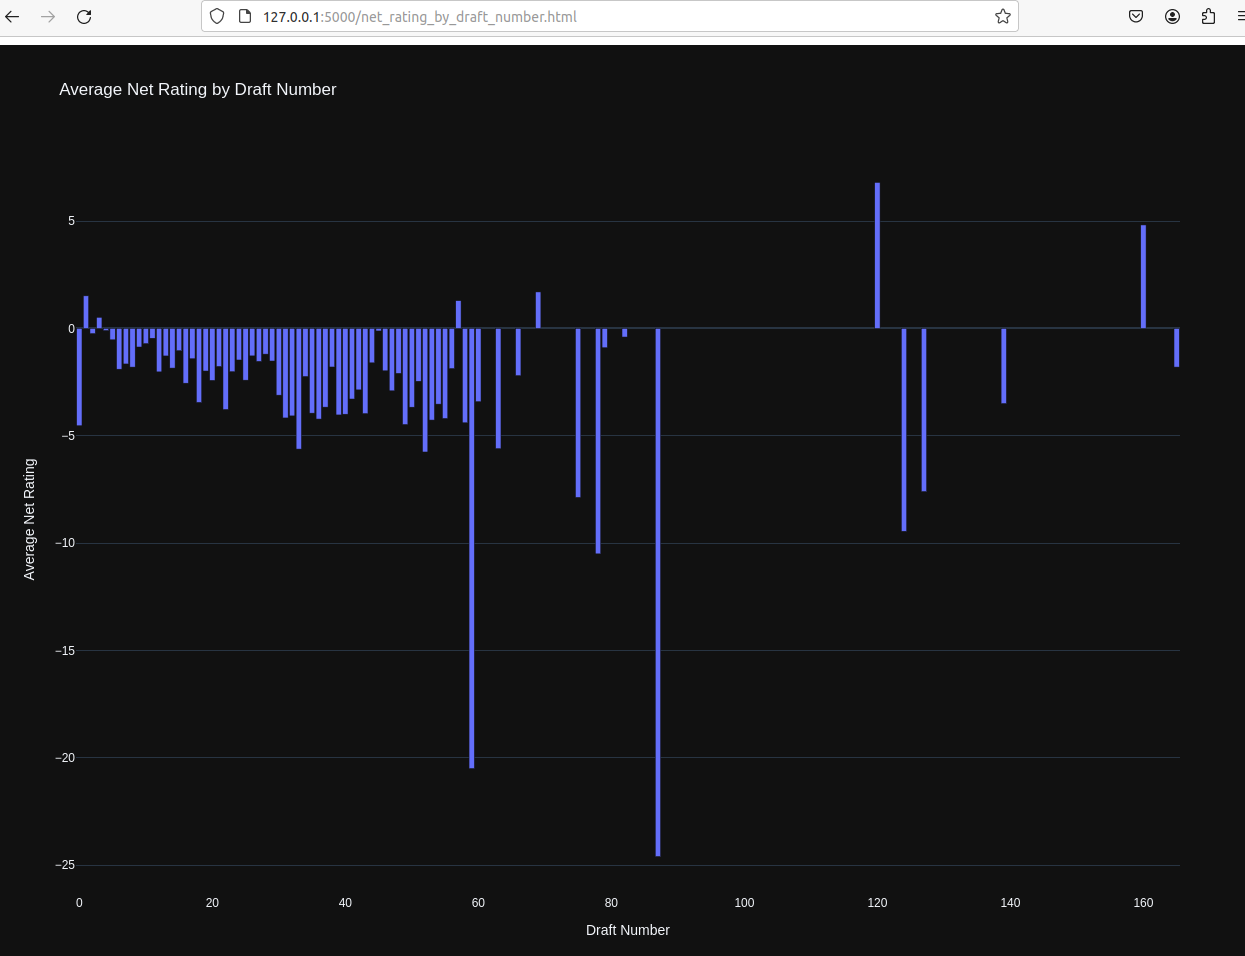
出乎意料的,球员顺位与其在场球队百回合净胜分在正负上并没有表现出特别明显的相关性,输分才是大多人的情况,但是可以看出至少靠前顺位的球员输分相对较少。
不同大学培养的球员在NBA的平均得分、助攻和篮板表现:
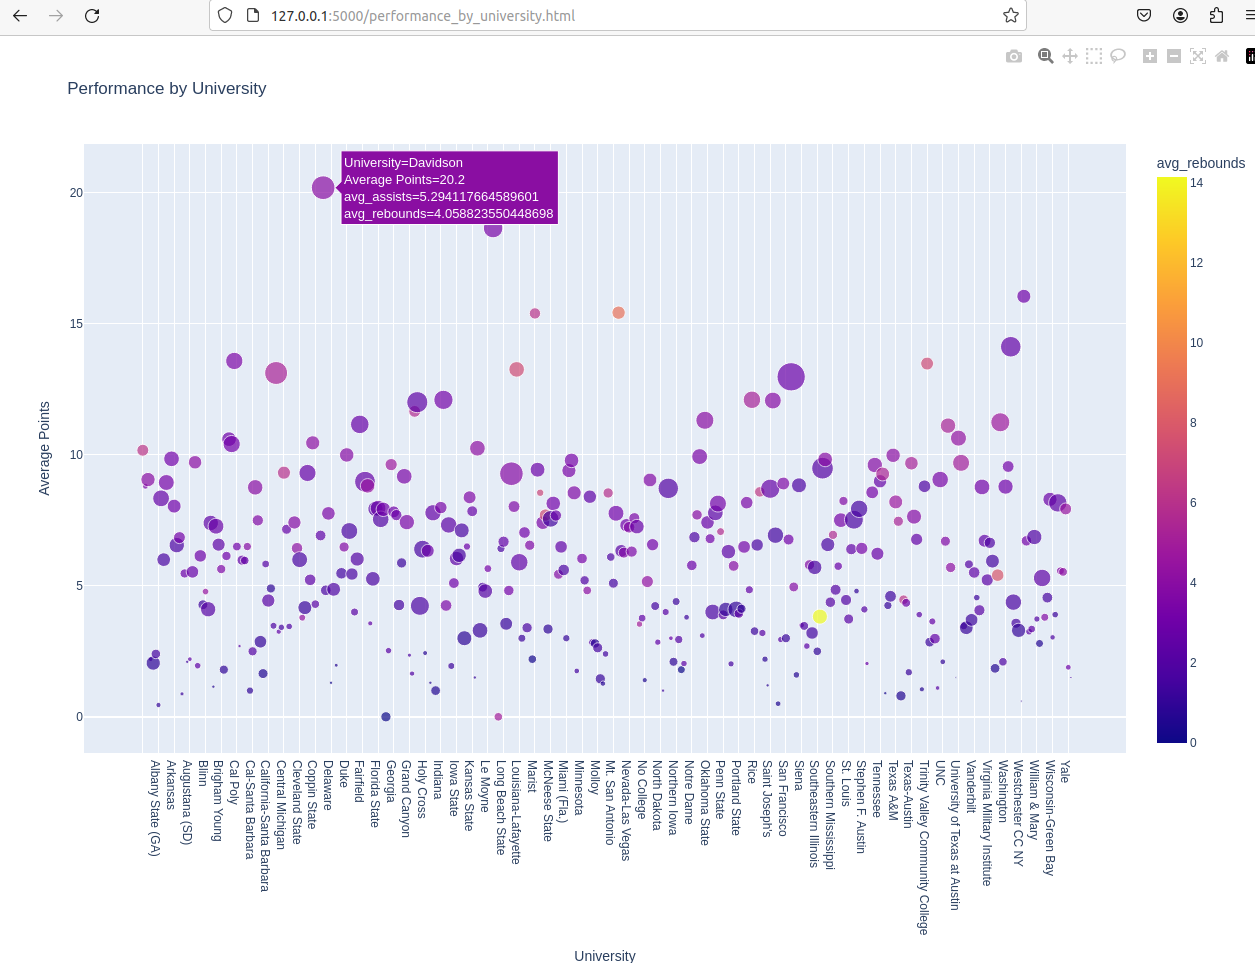
从平均数据上来看,各大学差别不大(这里并没有限制人数,如图中文字标注点,Davidson大学在得分、助攻上表现十分优异,其实是因为Stephen Curry的存在,而该大学本身实力并不如意,进入NBA的总人数本就很少)。
分别为NBA贡献总得分、总篮板和总助攻最多的Top 50大学
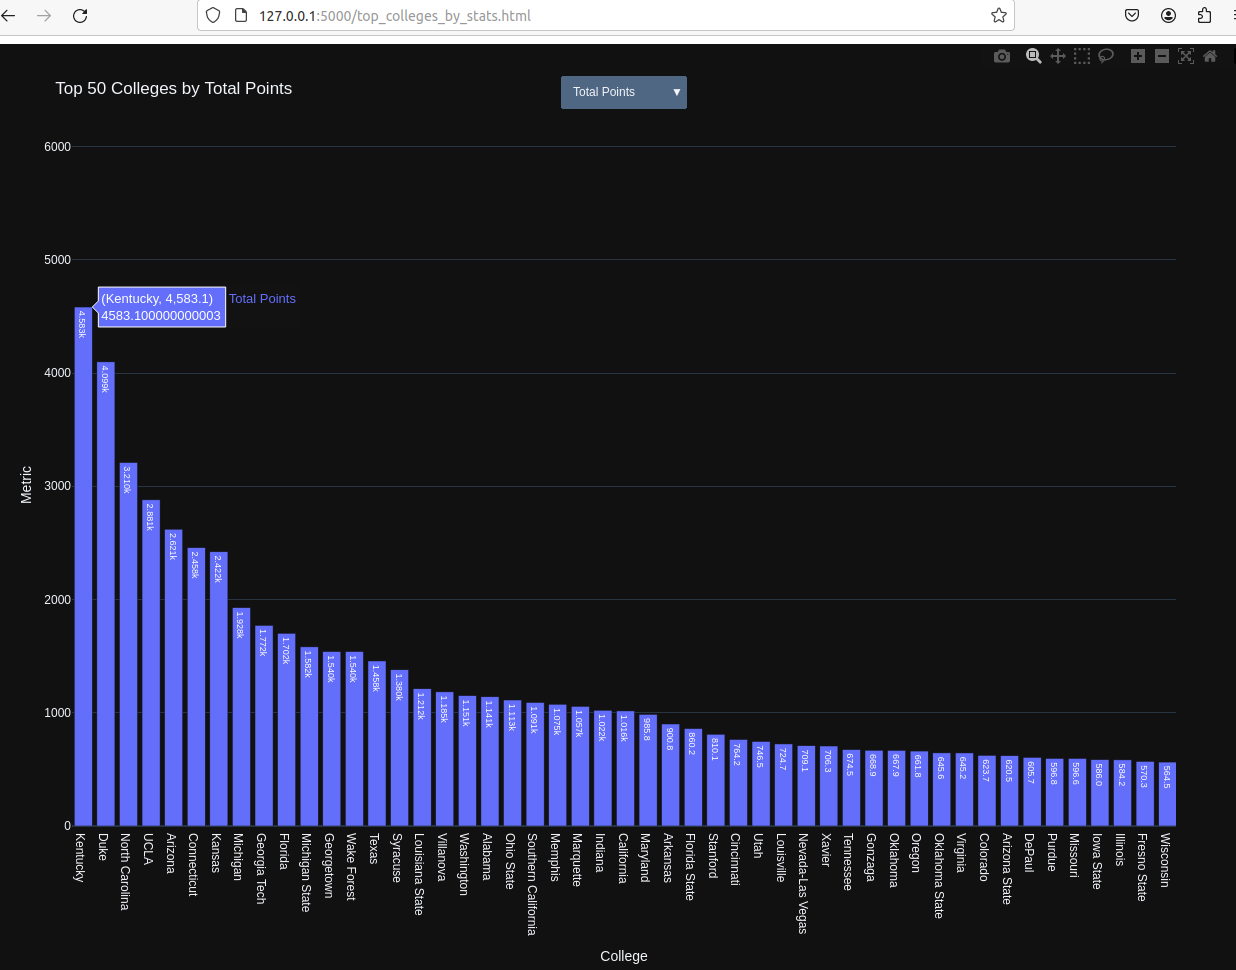
对应于上图,从总量尺度上看,存在几个实际强劲的头部大学,如Duke、Kentucky、UCLA等,出身于这些大学的球员平均实力更强,无论是得分、篮板或是助攻,为联盟贡献了许多优秀球员。
