【版权声明】版权所有,严禁转载,严禁用于商业用途,侵权必究。
作者:厦门大学计算机科学与技术系2023级研究生 方明俊
指导老师:厦门大学数据库实验室 林子雨 博士/副教授
时间:2024年6月
相关教材:林子雨编著《Flink编程基础(Java版)》(访问教材官网)
相关案例:Flink大数据处理分析案例集锦
本案例使用Java语言编写Flink程序。使用Python语言编写网络爬虫程序,从链家网站爬取厦门二手房数据,然后进行数据清洗,保存到分布式文件系统HDFS中,接下来使用Java语言编写Flink程序进行数据分析,最后,采用PyECharts和网页形式进行数据可视化。
一.实验环境
1.Linux: Ubuntu 20.04.6(内核: 5.4.0-169-generic)
2.Hadoop: 3.3.5
3.Flink:1.17.0
4.Python: 3.8.10
5.JDK1.8
6.开发工具:IntelliJ IDEA, VS Code
7.可视化分析: python的matplotlib
从百度网盘下载本案例的数据集和代码。(提取码是ziyu)
二.数据集获取及预处理
1.实验数据介绍
虽然网上有大量关于二手房的房源数据,但是这些数据中很大一部分过于陈旧(大部分为18-21年的),与现在厦门房价有一定不同;另外一部分数据集不是厦门的房价而是北京,成都等其他地方的房源数据。故本次实验所采用的数据,均为我从链家官网中的在售厦门二手房页面爬取(网址:https://xm.lianjia.com/ershoufang/ ,爬虫的代码附在spider.py中)。数据集的内容包括房屋总价,每平米均价,该房屋关注人数,房子户型,所在小区及所属区,楼层概况,装修情况,挂牌时间等信息。爬虫得到的数据规模为3000条数据,在进行数据预处理后共得到2994条有效数据。本次大作业中主要计算分析了TODO。
特别说明:实验所用数据均为网上爬取,没有得到官方授权使用,使用范围仅限本次实验使用,请勿用于商业用途
2.数据集获取
观察网址发现url格式为https://xm.lianjia.com/ershoufang/pg(n), 所以使用user-agent包装HTTP请求头并将请求得到response的内容进行HTML解析。链家网站上每一页上都有30条二手房房源信息,可以通过同一url格式访问到的页面共有100页(如果n>100那会被重定向到第一页),而每一条房源信息的HTML可以按照固定格式解析,所以可以用循环遍历同一页的所有二手房信息。由于每一条房源点进去都有“详情”页面,而“详情”页面的url也可以通过HTML解析得到,所以当遍历完某一页面所有房源信息后可以依次进入“详情”页面爬取更多信息。通过html.xpath()接口,可以将HTML页面含有的信息解析成列表或者字符串格式以便保存到CSV中。
爬虫spider.py的代码如下:
import requests
from lxml import html
from lxml import etree
from html.parser import HTMLParser
import pandas as pd
import numpy as np
import time
import random

def parse_url(url):
    # 输入链接,返回解析后的html
    headers = {
        "User-Agent": "Mozilla/5.0 (Windows NT 10.0; Win64; x64) AppleWebKit/537.36 (KHTML, like Gecko)  Chrome/27.0.1453.94"}
    response = requests.get(url=url, headers=headers)
    content = response.content.decode('utf-8', 'ignore')
    html = etree.HTML(content)
    return html

def get_base_info(page_url):
    # 获取基础信息
    html = parse_url(page_url)
    print("page url", page_url)
    titles = []
    urls = []
    total_prices = []
    unit_prices = []
    followers = []
    for i in range(1,31):
        titlexpath = '//*[@id="content"]/div[1]/ul/li[' + str(i) + ']/div[1]/div[1]/a/text()'
        urlxpath = '//*[@id="content"]/div[1]/ul/li[' + str(i) + ']/a/@href'
        totalpricexpath = '//*[@id="content"]/div[1]/ul/li[' + str(i) + ']/div[1]/div[6]/div[1]/span/text()'
        unitprice = '//*[@id="content"]/div[1]/ul/li[' + str(i) + ']/div[1]/div[6]/div[2]/span/text()'
        follower = '//*[@id="content"]/div[1]/ul/li[' + str(i) + ']/div[1]/div[4]/text()'
        titles.append (html.xpath(titlexpath)) #标题

        temp_url = html.xpath(urlxpath)
        urls.append(temp_url)  # 链接
        #print(temp_url)
        total_prices.append(html.xpath(totalpricexpath))  # 总价
        unit_prices.append(html.xpath(unitprice))  # 均价

        temp_follower = html.xpath(follower)
        if temp_url[0].count('goodhouse') == 0:
            #print(temp_follower[0].split('/')[0])
            followers.append(temp_follower[0].split('/')[0])
        else :
            followers.append(temp_follower)

    #print("title is",titles)
    #print("url is",urls)
    #print("total_prices is",total_prices)
    #print("total_prices is",unit_prices)
    #print("followers is",followers)

    base_infos = []  # 使用一个列表存储所有信息
    for title, url, total_price, unit_price, follower in zip(titles, urls, total_prices, unit_prices,followers):
        #print('title is %s,url is %s,total_price is %s,unit_price is %s' % (title,url,total_price,unit_price))
        # 将信息写入一个字典中
        info = {}
        info['title'] = title
        info['url'] = "".join(url)
        info['total_price'] = total_price
        info['unit_price'] = unit_price
        info['follower'] = follower
        base_infos.append(info)
    return base_infos

def get_extra_info_plus(info):
    # 进入详情页获取更多信息
    info_url = info['url']
    print("info url",info_url)
    html = parse_url(info_url)
    try:
        info['huxing'] = html.xpath(
            '//*[@id="introduction"]/div/div/div[1]/div[2]/ul/li[1]/text()')[1].strip()
    except:
        info['huxing'] = ''
    #print("huxing is",info['huxing'])

    try:
        info['louceng'] = html.xpath(
            '/html/body/div[5]/div[2]/div[4]/div[1]/div[2]/text()')
    except:
        info['louceng'] = ''
    #print("luceng is",info['louceng'])

    try:
        info['chaoxiang'] = html.xpath(
            '/html/body/div[5]/div[2]/div[4]/div[2]/div[1]/text()')
    except:
        info['chaoxiang'] = ''
    #print("chaoxiang is",info['chaoxiang'])

    try:
        info['zhuangxiu'] = html.xpath(
            '/html/body/div[5]/div[2]/div[4]/div[2]/div[2]/text()')
    except:
        info['zhuangxiu'] = ''
    #print("zhuangxiu is",info['zhuangxiu'])

    try:
        info['building_area'] = html.xpath(
            '/html/body/div[5]/div[2]/div[4]/div[3]/div[1]/text()')
    except:
        info['building_area'] = ''
    #print("building_area is",info['building_area'])

    try:
        info['build_year'] = html.xpath(
            '/html/body/div[5]/div[2]/div[4]/div[3]/div[2]/text()[1]')
    except:
        info['build_year'] = ''
    #print("build_year is",info['build_year'])

    try:
        info['community_name'] = html.xpath(
            '/html/body/div[5]/div[2]/div[5]/div[1]/a[1]/text()')
    except:
        info['community_name'] = ''
    #print("community_name is",info['community_name'])

    try:
        info['location_info'] = html.xpath(
            '/html/body/div[5]/div[2]/div[5]/div[2]/span[2]/a[1]/text()')
    except:
        info['location_info'] = ''
    #print("location_info is",info['location_info'])

    try:
        info['location_info_sec'] = html.xpath(
            '/html/body/div[5]/div[2]/div[5]/div[2]/span[2]/a[2]/text()')
    except:
        info['location_info_sec'] = ''
    #print("location_info_sec is",info['location_info_sec'])

    try:
        info['elevator'] = html.xpath(
            '//*[@id="introduction"]/div/div/div[1]/div[2]/ul/li[11]/text()')[1].strip()
    except:
        info['elevator'] = ''
    #print("elevator is",info['elevator'])

    try:
        info['elevator_house'] = html.xpath(
            '//*[@id="introduction"]/div/div/div[1]/div[2]/ul/li[10]/text()')[1].strip()
    except:
        info['elevator_house'] = ''
    #print("elevator_house is",info['elevator_house'])

    try:
        info['listing_day'] = html.xpath(
            '//*[@id="introduction"]/div/div/div[2]/div[2]/ul/li[1]/span[2]/text()')
    except:
        info['listing_day'] = ''
    #print("listing_day is",info['listing_day'])

    try:
        info['last_trade'] = html.xpath(
            '//*[@id="introduction"]/div/div/div[2]/div[2]/ul/li[3]/span[2]/text()')
    except:
        info['last_trade'] = ''
    #print("last_trade is",info['last_trade'])

    return info

base_url = 'https://xm.lianjia.com/ershoufang/'
infos = []
for i in range(1, 101):
    time.sleep(random.randint(5, 8))  # 设置休息时间应对反爬
    if i != 1:
        page_url = base_url + "pg" + str(i)
    else :
        page_url = base_url
    results = get_base_info(page_url)
    #print(results)
    infos.extend(results)
    #print(infos)
    if infos[i-1] != '':
        print(f'爬取页面{i}的基础信息成功!')

for i in range(0, len(infos)):
    time.sleep(random.randint(2, 5))
    infos[i] = get_extra_info_plus(infos[i])
    if infos[i]['huxing'] == '' and infos[i]['location_info'] == '' and infos[i]['url'].count('goodhouse') == 0:  # 如果这两个值都为空值,说明开始人机验证了
        print(f'爬取第{i}条信息失败,请进行人机验证! ')
        print(infos[i]['url'])
        # 及时保存数据
        data = pd.DataFrame(infos)
        data.to_csv('data_temp.csv')
        break
    else:
        print("爬取第{}条信息成功:{}".format(i, infos[i]['title']))

data = pd.DataFrame(infos)
data.to_csv('data_temp.csv')  # 导出到csv文件
3.数据集存储与数据清洗
在spider.py中获得的信息用append操作保存到list后利用pd.DataFram()接口直接存储为CSV文件。在爬取时需要去除冗余信息,通过截取(具体的实现是用split/join等函数)或者选取下标的方式去除冗余信息。以下举两个例子来说明如何去除冗余信息:
(1)在‘电梯情况’字段中原始数据是”[‘电梯情况’,‘有/无’]”,那么此时只有后一个字段是我们关心的,所以直接选取后一个字段进行保存即可。
在得到CSV文件之后调用clean.py进行数据清洗。
(1)用dropna()去除空元素(将subset 参数设置为['total_price','unit_price',
'location_info','building_area'],即如果某个元素的房屋总价,房屋均价,所 属区,建筑面积中有任何一个味空字段,则视为非空元素)。
(2)利用drop_duplicate()去掉重复元素。之后综合运用字符串str.replace(),
str.split(),pd.to_numeric(),math.isnan()等函数将数据清洗为可用的 格式。
(3)针对“建筑年份”,“电梯情况”,“梯户配比”等字段出现的“未知”,“暂无数据”等字段统一设为0或-1以方便后续处理。
(4)利用cn2an()模块中的cn2an.transform()函数将中文数字(如‘二十八’)转换为阿拉伯数字。
(5)利用条件筛选过滤掉不符合真实情况或者违背常识的数据,比如去掉每平米单价小于1000或者大于150000的数据;去掉建筑面积小于20平方米或者大于1000平方米的数据
(6)在步骤五之后,每平米价格是四位到六位数,但是其表示方式是三位一个逗号(例: 21,764元/平), 由于房屋均价都是四位数或六位数,所以预先把后面的“元/平”截断后利用split得到21和764,再利用join函数将21和764进行拼接。
(7)值得注意的是,由于‘title’字段通常是该房源的宣传语,而其中的中文和英文逗号(“,”和“,”)混用,这在后续flink读取位于HDFS的csv文件时会与csv格式字段间用于间隔的英文逗号混淆,从而导致解析格式错误。所以把‘title’字段中所有的逗号都统一成中文逗号。
在完成上述步骤后利用pandas库将dataframe保存为CSV文件。
数据清洗代码:
import pandas as pd
import cn2an
import math

housedata = pd.read_csv("/home/user/farmerj/bigdata/xmhouse_data.csv",engine='python',encoding='utf-8')

#将titie中的英文逗号转换为中文逗号
housedata['title'] = housedata['title'].str.replace(',', ',')

# 将total_price转化为数字
housedata['total_price'] = housedata['total_price'].str.replace('[', '').str.replace(']', '').str.replace('\'','')
housedata['total_price'] = pd.to_numeric(housedata['total_price'],errors='ignore')

# 将listing_day和last_trade转化为日期
housedata['listing_day'] = housedata['listing_day'].apply(lambda x: pd.to_datetime(x.replace('[', '').replace(']', '').replace('\'','')) if x != '[\'暂无数据\']' else pd.NaT)
housedata['last_trade'] = housedata['last_trade'].apply(lambda x: pd.to_datetime(x.replace('[', '').replace(']', '').replace('\'','')) if x != '[\'暂无数据\']' else pd.NaT)

# 去除unit_price字段中的‘元/平’
housedata['unit_price'] = housedata['unit_price'].str.replace('[', '').str.replace(']', '').str.replace('\'','').str.replace('元/平', '').str.split(',').str.join('')
housedata['unit_price'] = pd.to_numeric(housedata['unit_price'],errors='ignore')
housedata = housedata[(housedata['unit_price'] >= 1000) & (housedata['unit_price'] <= 150000)]

# 去除building_area字段中的‘平米’
housedata['building_area'] = housedata['building_area'].str.replace('[', '').str.replace(']', '').str.replace('\'','').str.replace('平米', '')
housedata['building_area'] = pd.to_numeric(housedata['building_area'],errors='ignore')
housedata = housedata[(housedata['building_area'] >= 20) & (housedata['building_area'] <= 1000)]

# 去除build_year字段中的‘年建’
housedata['build_year'] = housedata['build_year'].str.replace('[', '').str.replace(']', '').str.replace('\'','').str.replace('年建', '')
housedata['build_year'] = housedata['build_year'].str.replace('未知', '-1')
housedata['build_year'] = pd.to_numeric(housedata['build_year'],errors='ignore')

# 选取chaoxiang字段中的主朝向
housedata['chaoxiang'] = housedata['chaoxiang'].str.replace('[', '').str.replace(']', '').str.replace('\'','').str.split(' ')
housedata['chaoxiang'] = housedata['chaoxiang'].str[0]

# 根据‘/’截断zhuangxiu字段
housedata[['cengshi', 'zhuangxiuchengdu']] = housedata['zhuangxiu'].str.replace('[', '').str.replace(']', '').str.replace('\'','').str.split('/', expand=True)

#根据‘/’截断louceng字段
housedata[['height_location', 'height']] = housedata['louceng'].str.replace('[', '').str.replace(']', '').str.replace('\'','').str.split('共', expand=True)

housedata['height_location'] = housedata['height_location'].str.replace('/', '').str.replace('地下室', '0').str.replace('低楼层', '1').str.replace('中楼层', '2').str.replace('高楼层', '3').str.replace('联排', '4')
housedata['height_location'] = housedata['height_location'].apply(lambda x: x.replace('','-1') if x == '' else x)
housedata['height_location'] = pd.to_numeric(housedata['height_location'],errors='ignore')

housedata['height'] = housedata['height'].str.replace('共', '').str.replace('层', '').str.replace('/', '')
housedata['height'] = pd.to_numeric(housedata['height'],errors='ignore')
housedata['height'] = pd.to_numeric(housedata['height'],errors='ignore')

#其他数据去掉爬虫保存格式list中的“['']”内容
housedata['title'] = housedata['title'].str.replace('[', '').str.replace(']', '').str.replace('\'','')
housedata['community_name'] = housedata['community_name'].str.replace('[', '').str.replace(']', '').str.replace('\'','')
housedata['location_info'] = housedata['location_info'].str.replace('[', '').str.replace(']', '').str.replace('\'','')
housedata['location_info_sec'] = housedata['location_info_sec'].str.replace('[', '').str.replace(']', '').str.replace('\'','')

#去除follower字段的‘人关注’
housedata['follower'] = housedata['follower'].str.replace('[', '').str.replace(']', '').str.replace('\'','').str.replace('人关注', '')

#将elevator,elevator_house字段进行统一格式
housedata['elevator'] = housedata['elevator'].str.replace('暂无数据', '0').str.replace('有', '1').str.replace('无','0')
housedata['elevator'] = pd.to_numeric(housedata['elevator'],errors='ignore')
housedata['elevator'] = housedata['elevator'].apply(lambda x: 0 if math.isnan(x) == True else x)

housedata['elevator_house'] = housedata['elevator_house'].str.replace('暂无数据', '零梯零户')
housedata['elevator_house'] = housedata['elevator_house'].apply(lambda x: '零梯零户' if type(x) == float else x)
housedata[['elevator_num', 'house_num']] = housedata['elevator_house'].str.replace('户', '').str.replace('梯', ' ').str.split(' ', expand=True)
housedata['elevator_num'] = housedata['elevator_num'].apply(lambda x: cn2an.transform(x))
housedata['house_num'] = housedata['house_num'].apply(lambda x: cn2an.transform(x))

#去除空元素
housedata.dropna(axis=0, subset=['total_price','unit_price','location_info','building_area'], inplace=True)

#去除重复元素
housedata.drop_duplicates(subset=['url'], keep='first',inplace=True)

housedata.to_csv('xmhouse_data_clean.csv')
4.将数据集存放至分布式文件系统HDFS
(1)在HDFS文件系统中创建数据集目录
cd /usr/local/hadoop
./bin/hdfs dfs -mkdir -p /fmj/xmhouseprice
(2)将清洗后的数据导入HDFS文件系统中
cd /usr/local/hadoop
./bin/hdfs dfs -put /home/user/farmerj/bigdata/xmhouse_data_clean.csv /fmj/xmhouseprice
(3)查看导入结果
cd /usr/local/hadoop
./bin/hdfs dfs -ls /fmj/xmhouseprice
三.基于Java语言使用flink进行数据处理与分析
1.建立工程文件
(1)使用Maven快速构建Flink应用骨架代码,执行如下命令:
mvn archetype:generate                \
  -DarchetypeGroupId=org.apache.flink   \
  -DarchetypeArtifactId=flink-quickstart-java \
  -DarchetypeVersion=1.17.0
其中groupId:org.xmu
artifactId:xiamenhouseprice
package:org.xmu.houseprice
(2)在主目录下创建outputData文件夹,用于存放数据分析之后的数据结果(存放CSV文件)
(3)将src/main/java/org/xmu/houseprice文件夹下的DataStreamJob作为main类。将数据导入,数据分析和处理以及数据存储的代码都以函数的形式在这个类中完成。
(4)创建HouseMessage类,用于存放房源信息的各个字段。其中主要是各个数据字段的Set和Get函数,还有一些由于数据分析的需求所写的Get函数获得一些拼接字段。
(5)对于为了进行数据分析而进行重载的类(如ReduceFunction,AggregateFunction,ProcessAllWindowFunction等),可以选择新开一个类进行extends+implement来重写接口,但我使用的是在对应Process的函数中直接@Override,省去了开新类的步骤。
2.从HDFS中读取数据
首先定义HDFS对应的本机IP地址和端口号,以及清洗后的数据存放的路径。

接下来利用flink的readfile接口进行文件的读取,并设置并行度为1以防止由于并行所引起的重复数据等问题。之后利用datastream的map函数进行解析与映射,由于读取的是csv文件,所以直接以逗号作为分隔符即可(String[] datas = value.split(","))。由于第一行在pandas保存到csv文件时第一行会存字段对应的索引名。所以在读取数据时把那一行当做空行读取。读取后的数据经过过滤空字段后再进行数据分析。

3.进行数据分析
(1)统计每个区的房源总数
思路:
利用时间窗口截断流输入来保证所有数据都被读取。将所有数据按照不同行政区(比如思明区,湖里区)进行分区操作,定义Tuple2<String, Integer>数据结构,String表示行政区,Integer表示当前行政区共有多少房源。Map操作是将每条记录计数为1(每个房源贡献一条有效计数),在按照不同行政区进行分区后进行Reduce操作,由于保证了在同一分区的键值对属于同一行政区,所以把他们的计数器(value.f1)相加即可。
步骤:
1)利用HouseMessage::getLocationInfo获取行政区信息进行Keyby分区操作
2)Override(下称覆盖) map函数将每个键值对定义为<行政区,1>(表示一个计数值)
3).keyBy(value -> value.f0)按照不同行政区进行分区
4)覆盖 Reduce函数,返回Tuple2.of(value1.f0, value1.f1 + value2.f1)来合并计数值
5)按照每个行政区的房源总数(tuple.f1)作为比较值进行排序操作,从高到低排列每个行政区所爬取的房源数量
6)利用writeAsCsv将获得的数据保存到CSV文件中
该函数对应代码如下:
private static SingleOutputStreamOperator<Tuple2<String, Integer>> TotalHouseOfLocationFunction(DataStream<HouseMessage> filteredStream) {
    // 调用函数来进行聚类统计操作
    SingleOutputStreamOperator<Tuple2<String, Integer>> aggregatedStream = filteredStream
            .keyBy(HouseMessage::getLocationInfo)
            .map(new MapFunction<HouseMessage, Tuple2<String, Integer>>() {
                @Override
                public Tuple2<String, Integer> map(HouseMessage value) throws Exception {
                    return Tuple2.of(value.getLocationInfo(), 1); // 每条记录计数为1
                }
            })
            .keyBy(value -> value.f0) // Key by location_info
            .timeWindow(Time.seconds(5))
            .reduce(new ReduceFunction<Tuple2<String, Integer>>() {
                @Override
                public Tuple2<String, Integer> reduce(Tuple2<String, Integer> value1, Tuple2<String, Integer> value2) throws Exception {
                    // 同一区域的房源总数相加
                    return Tuple2.of(value1.f0, value1.f1 + value2.f1);
                }
            });
    SingleOutputStreamOperator<Tuple2<String, Integer>> sortedAggregatedStream = aggregatedStream
            .timeWindowAll(Time.seconds(5))
            .process(new ProcessAllWindowFunction<Tuple2<String, Integer>, Tuple2<String, Integer>, TimeWindow>() {
                @Override
                public void process(Context context, Iterable<Tuple2<String, Integer>> elements, Collector<Tuple2<String, Integer>> out) {
                    List<Tuple2<String, Integer>> sortedList = new ArrayList<>();
                    for (Tuple2<String, Integer> element : elements) {
                        sortedList.add(element);
                    }
                    sortedList.sort(Comparator.comparingInt((Tuple2<String, Integer> tuple) -> tuple.f1).reversed());
                    for (Tuple2<String, Integer> element : sortedList) {
                        out.collect(element);
                    }
                }
            });
    sortedAggregatedStream.map(new MapFunction<Tuple2<String, Integer>, Tuple2<String, Integer>>() {
        @Override
        public Tuple2<String, Integer> map(Tuple2<String, Integer> value) throws Exception {
            logger.info("TotalHouse Data: {}", value.toString()); // 使用局部的 final logger
            return value;
        }
    });
    String csvFileName = "/home/user/farmerj/bigdata/xmhouseprice/outputData/TotalHouseOfLocation.csv";
    sortedAggregatedStream.writeAsCsv(csvFileName, FileSystem.WriteMode.OVERWRITE)
            .setParallelism(1) // 控制并行度,以确保输出结果的顺序
            .name("TotalHouseOfLocation CSV Sink");
    return sortedAggregatedStream;
(2)统计每一个街区的平均房价
思路:
利用时间窗口截断流输入来保证所有数据都被读取。将所有数据按照不同街区(比如思明区_实验小学周边)进行分区操作,定义Tuple3<String, Double, Integer>数据结构,String表示街区信息,Double表示当前街区的房源的总房价,Integer表示该街区的房源总数。重写AggregateFunction。add操作是将该房源的房源价格加到累加器中,该累加器每个房源计数值加一,merge操作将累加器中的房源总价和房源总数分别相加。最后通过获取结果的函数getresult中将房源总价除以房源总数即可获得该街区的平均房价。
步骤:
1)利用filter函数过滤掉没有街区信息的房源数据(LocationInfoSec字段为空的)
2)按照上述思路重写AggregateFunction函数
3)在最后得到结果之后利用sortedList函数按照平均房价从高到低排序
4)利用WriteAsCsv函数保存到CSV文件中
该函数对应代码如下:
public static DataStream<Tuple2<String, Double>> calculateAvgUnitPriceByLocationSec(DataStream<HouseMessage> houseMessageStream) {
        DataStream<Tuple2<String, Double>> avgUnitPriceStream = houseMessageStream
                // 过滤掉没有 locationInfoSec 的消息
                .filter(houseMessage -> houseMessage.getLocationInfoSec() != null && !houseMessage.getLocationInfoSec().isEmpty())
                .keyBy(HouseMessage::getCompositeKey)
                .timeWindow(Time.seconds(5))
                .aggregate(new AggregateFunction<HouseMessage, Tuple3<String, Double, Integer>, Tuple2<String, Double>>() {
                    @Override
                    public Tuple3<String, Double, Integer> createAccumulator() {
                        return Tuple3.of("", 0.0, 0); // 初始化累计器
                    }

                    @Override
                    public Tuple3<String, Double, Integer> add(HouseMessage value, Tuple3<String, Double, Integer> accumulator) {
                        return Tuple3.of(value.getCompositeKey(), accumulator.f1 + value.getUnitPrice(), accumulator.f2 + 1); // 累加 unitPrice 和数量
                    }

                    @Override
                    public Tuple2<String, Double> getResult(Tuple3<String, Double, Integer> accumulator) {
                        return Tuple2.of(accumulator.f0, accumulator.f1 / accumulator.f2); // 返回组合键 和 平均 unitPrice
                    }

                    @Override
                    public Tuple3<String, Double, Integer> merge(Tuple3<String, Double, Integer> a, Tuple3<String, Double, Integer> b) {
                        return Tuple3.of(a.f0, a.f1 + b.f1, a.f2 + b.f2); // 合并两个累计器
                    }
                }, new ProcessWindowFunction<Tuple2<String, Double>, Tuple2<String, Double>, String, TimeWindow>() {
                    @Override
                    public void process(String key, ProcessWindowFunction<Tuple2<String, Double>, Tuple2<String, Double>, String, TimeWindow>.Context context, Iterable<Tuple2<String, Double>> elements, Collector<Tuple2<String, Double>> out) {
                        for (Tuple2<String, Double> element : elements) {
                            out.collect(element); // 输出每个区域的平均 unitPrice
                        }
                    }
                });

        // 对结果进行排序
        avgUnitPriceStream = avgUnitPriceStream
                .timeWindowAll(Time.seconds(5))
                .process(new ProcessAllWindowFunction<Tuple2<String, Double>, Tuple2<String, Double>, TimeWindow>() {
                    @Override
                    public void process(ProcessAllWindowFunction<Tuple2<String, Double>, Tuple2<String, Double>, TimeWindow>.Context context,
                                        Iterable<Tuple2<String, Double>> elements, Collector<Tuple2<String, Double>> out) {
                        List<Tuple2<String, Double>> sortedList = new ArrayList<>();
                        for (Tuple2<String, Double> element : elements) {
                            sortedList.add(element);
                        }
                        sortedList.sort(Comparator.comparingDouble((Tuple2<String, Double> tuple) -> tuple.getField(1)).reversed());
                        for (Tuple2<String, Double> element : sortedList) {
                            out.collect(element);
                        }
                    }
                });

        avgUnitPriceStream.map(new MapFunction<Tuple2<String, Double>, Tuple2<String, Double>>() {
            @Override
            public Tuple2<String, Double> map(Tuple2<String, Double> value) throws Exception {
                logger.info("AvgUnitPrice Data: {}", value.toString());
                return value;
            }
        });

        String csvFileName = "/home/user/farmerj/bigdata/xmhouseprice/outputData/avgUnitPriceStream.csv";
        avgUnitPriceStream.writeAsCsv(csvFileName, FileSystem.WriteMode.OVERWRITE)
                .setParallelism(1) // 控制并行度,以确保输出结果的顺序
                .name("avgUnitPriceStream CSV Sink");

        return avgUnitPriceStream;
(3)统计不同年份的房源平均有梯户比的信息
思路:
利用时间窗口截断流输入来保证所有数据都被读取。将所有数据按照不同建筑年份进行分区操作,定义Tuple3<Integer, Double, Integer>数据结构,f0表示建筑年份信息,Double表示当前街区的房源的总电梯数量,Integer表示该年份房源总数。对AggregateFunction进行重写。add操作是将该房源对应楼栋的梯户比(把一层的户数除以电梯数)加到累加器中,该累加器每个房源计数值加一;merge操作将累加器中的梯户比总数和房源总数分别相加。最后通过获取结果的函数getresult中将房源梯户比除以房源总数即可获得该街区的平均梯户比。
步骤:
1)按照上述思路重写AggregateFunction函数
2)在最后得到结果之后利用sortedList函数按照平均梯户比从高到低排序
3)利用WriteAsCsv函数保存到CSV文件中
该函数对应代码如下:
public static DataStream<Tuple3<Integer, Double, Integer>> calculateAvgElevatorNumByYear(DataStream<HouseMessage> houseMessageStream) {
        DataStream<Tuple3<Integer, Double, Integer>> avgElevatorNumByYearStream = houseMessageStream
                .keyBy(HouseMessage::getBuildingYear)
                .timeWindow(Time.seconds(5))
                .aggregate(
                        new AggregateFunction<HouseMessage, Tuple3<Integer, Double, Integer>, Tuple3<Integer, Double, Integer>>() {
                            @Override
                            public Tuple3<Integer, Double, Integer> createAccumulator() {
                                return Tuple3.of(0, 0.0, 0);
                            }

                            @Override
                            public Tuple3<Integer, Double, Integer> add(HouseMessage value, Tuple3<Integer, Double, Integer> accumulator) {
                                return Tuple3.of(value.getBuildingYear(), accumulator.f1 + value.getElevatorNum(), accumulator.f2 + 1);
                            }

                            @Override
                            public Tuple3<Integer, Double, Integer> getResult(Tuple3<Integer, Double, Integer> accumulator) {
                                return accumulator;
                            }

                            @Override
                            public Tuple3<Integer, Double, Integer> merge(Tuple3<Integer, Double, Integer> a, Tuple3<Integer, Double, Integer> b) {
                                return Tuple3.of(a.f0, a.f1 + b.f1, a.f2 + b.f2);
                            }
                        },
                        new ProcessWindowFunction<Tuple3<Integer, Double, Integer>, Tuple3<Integer, Double, Integer>, Integer, TimeWindow>() {
                            @Override
                            public void process(
                                    Integer key,
                                    Context context,
                                    Iterable<Tuple3<Integer, Double, Integer>> elements,
                                    Collector<Tuple3<Integer, Double, Integer>> out
                            ) {
                                Tuple3<Integer, Double, Integer> result = elements.iterator().next();
                                if (result.f2 == 0) {
                                    out.collect(Tuple3.of(key, 0.0, 0));
                                } else {
                                    double avgHouseElevatorDivide = result.f1 / result.f2;
                                    out.collect(Tuple3.of(key, avgHouseElevatorDivide, result.f2));
                                }
                            }
                        }
                );

        avgElevatorNumByYearStream = avgElevatorNumByYearStream
                .timeWindowAll(Time.seconds(5))
                .process(new ProcessAllWindowFunction<Tuple3<Integer, Double, Integer>, Tuple3<Integer, Double, Integer>, TimeWindow>() {
                    @Override
                    public void process(Context context, Iterable<Tuple3<Integer, Double, Integer>> elements, Collector<Tuple3<Integer, Double, Integer>> out) {
                        List<Tuple3<Integer, Double, Integer>> sortedList = new ArrayList<>();
                        for (Tuple3<Integer, Double, Integer> element : elements) {
                            sortedList.add(element);
                        }
                        sortedList.sort(Comparator.comparingInt((Tuple3<Integer, Double, Integer> tuple) -> tuple.getField(0)));// Sort by building year
                        for (Tuple3<Integer, Double, Integer> element : sortedList) {
                            out.collect(element);
                        }
                    }
                });

        avgElevatorNumByYearStream.map(new MapFunction<Tuple3<Integer, Double, Integer>, Tuple3<Integer, Double, Integer>>() {
            @Override
            public Tuple3<Integer, Double, Integer> map(Tuple3<Integer, Double, Integer> value) throws Exception {
                logger.info("AvgElevatorNumByYear Data: {}", value.toString());
                return value;
            }
        });

        String csvFileName = "/home/user/farmerj/bigdata/xmhouseprice/outputData/avgElevatorNumByYear.csv";
        avgElevatorNumByYearStream.writeAsCsv(csvFileName, FileSystem.WriteMode.OVERWRITE)
                .setParallelism(1) // 控制并行度,以确保输出结果的顺序
                .name("avgElevatorNumByYearStream CSV Sink");

        return avgElevatorNumByYearStream;
    }
(4)房源宣传语词频统计
思路:
利用时间窗口截断流输入保证所有数据都被读取。由于是统计词频的任务,所以需要重写FlatMapFunction函数。选择中文逗号(在数据清洗时已统一所有逗号都为中文逗号),顿号,空白非打印字符(用\s表示,其中包含空格、换页符)。将切分后的字符串利用Collector 收集生成的 Tuple2<String, Integer> 对象。其中每个字符串标记为1(表示出现一次)。后续利用KeyBy将同一字符串分在同一分区并进行求和。
步骤:
1)利用上述思路重写flatmap函数
2)按照上述思路进行分区,并利用sum()函数求得词频
3)在最后得到结果之后利用Collections.sort函数按词频从高到低排序
4)利用WriteAsCsv函数保存到CSV文件中
该函数对应代码如下:
public static DataStream<Tuple2<String, Integer>> calculateTopWordFrequency(DataStream<HouseMessage> houseMessageStream) {
        // 提取 title 并进行分词
        DataStream<Tuple2<String, Integer>> wordStream = houseMessageStream
                .flatMap(new FlatMapFunction<HouseMessage, Tuple2<String, Integer>>() {
                    @Override
                    public void flatMap(HouseMessage value, Collector<Tuple2<String, Integer>> out) {
                        if (value.getTitle() != null) {
                            String[] words = value.getTitle().toLowerCase().split("[,、\\s]+");
                            for (String word : words) {
                                if (!word.isEmpty()) {
                                    out.collect(new Tuple2<>(word, 1));
                                }
                            }
                        }
                    }
                });

        // 统计词频
        SingleOutputStreamOperator<Tuple2<String, Integer>> wordCounts = wordStream
                .keyBy(new KeySelector<Tuple2<String, Integer>, String>() {
                    @Override
                    public String getKey(Tuple2<String, Integer> value) throws Exception {
                        return value.f0;
                    }
                })
                .timeWindow(Time.seconds(5))
                .sum(1);

        // 收集每个窗口的结果并排序
        SingleOutputStreamOperator<Tuple2<String, Integer>> sortedWordFrequencyStream = wordCounts
                .timeWindowAll(Time.seconds(5))
                .apply(new AllWindowFunction<Tuple2<String, Integer>, Tuple2<String, Integer>, TimeWindow>() {
                    @Override
                    public void apply(TimeWindow window, Iterable<Tuple2<String, Integer>> input, Collector<Tuple2<String, Integer>> out) throws Exception {
                        List<Tuple2<String, Integer>> wordFrequencyList = new ArrayList<>();
                        for (Tuple2<String, Integer> tuple : input) {
                            wordFrequencyList.add(tuple);
                        }
                        // 对词频进行排序
                        Collections.sort(wordFrequencyList, new Comparator<Tuple2<String, Integer>>() {
                            @Override
                            public int compare(Tuple2<String, Integer> o1, Tuple2<String, Integer> o2) {
                                return Integer.compare(o2.f1, o1.f1); // 降序排序
                            }
                        });
                        // 输出排序后的结果
                        for (Tuple2<String, Integer> tuple : wordFrequencyList) {
                            out.collect(tuple);
                        }
                    }
                });

        sortedWordFrequencyStream.map(new MapFunction<Tuple2<String, Integer>, Tuple2<String, Integer>>() {
            @Override
            public Tuple2<String, Integer> map(Tuple2<String, Integer> value) throws Exception {
                logger.info("SortedWordFrequency Data: {}", value.toString());
                return value;
            }
        });

        String csvFileName = "/home/user/farmerj/bigdata/xmhouseprice/outputData/sortedWordFrequency.csv";
        sortedWordFrequencyStream.writeAsCsv(csvFileName, FileSystem.WriteMode.OVERWRITE)
                .setParallelism(1) // 控制并行度,以确保输出结果的顺序
                .name("sortedWordFrequencyStream CSV Sink");

        return sortedWordFrequencyStream;
    }
(5)统计小区的房源数和关注人数
思路:
利用时间窗口截断流输入来保证所有数据都被读取。将所有数据按照不同小区进行分区操作,定义Tuple3<String, Integer, Integer>数据结构,f0表示小区信息,f1表示当前小区的房源的总关注人数,f2表示该街区的房源总数。重写AggregateFunction。add操作是将三元组中的关注人数加到累加器中,该累加器每个房源计数值加一,merge操作将累加器中的关注人数和房源总数分别相加。最后通过获取结果的函数getresult中直接返回累加值。
步骤:
1)按照上述思路重写AggregateFunction函数
2)在最后得到结果之后利用sortedList函数按照受欢迎程度从高到低排序
3)利用WriteAsCsv函数保存到CSV文件中
其中,将受欢迎程度定义为:总关注人数0.7 + 房源总数0.3,公式为:
该函数对应代码如下:
public static DataStream<Tuple3<String, Double, Integer>> calculateCommunityPopularity(DataStream<HouseMessage> houseMessageStream) {
        DataStream<Tuple3<String, Integer, Integer>> followerAndHouseCountStream = houseMessageStream
                .keyBy(HouseMessage::getLocationCommunityKey)
                .timeWindow(Time.seconds(5))
                .aggregate(new AggregateFunction<HouseMessage, Tuple3<String, Integer, Integer>, Tuple3<String, Integer, Integer>>() {
                    @Override
                    public Tuple3<String, Integer, Integer> createAccumulator() {
                        return Tuple3.of("", 0, 0);
                    }

                    @Override
                    public Tuple3<String, Integer, Integer> add(HouseMessage value, Tuple3<String, Integer, Integer> accumulator) {
                        return Tuple3.of(value.getLocationCommunityKey(), accumulator.f1 + value.getFollower(), accumulator.f2 + 1);
                    }

                    @Override
                    public Tuple3<String, Integer, Integer> getResult(Tuple3<String, Integer, Integer> accumulator) {
                        return accumulator;
                    }

                    @Override
                    public Tuple3<String, Integer, Integer> merge(Tuple3<String, Integer, Integer> a, Tuple3<String, Integer, Integer> b) {
                        return Tuple3.of(a.f0, a.f1 + b.f1, a.f2 + b.f2);
                    }
                }, new ProcessWindowFunction<Tuple3<String, Integer, Integer>, Tuple3<String, Integer, Integer>, String, TimeWindow>() {
                    @Override
                    public void process(String key, Context context, Iterable<Tuple3<String, Integer, Integer>> elements, Collector<Tuple3<String, Integer, Integer>> out) {
                        Tuple3<String, Integer, Integer> result = elements.iterator().next();
                        out.collect(Tuple3.of(key, result.f1, result.f2));
                    }
                });

        // 对结果进行排序,计算火爆指数
        SingleOutputStreamOperator<Tuple3<String, Double, Integer>> sortedPopularityStream = followerAndHouseCountStream
                .timeWindowAll(Time.seconds(5))
                .process(new ProcessAllWindowFunction<Tuple3<String, Integer, Integer>, Tuple3<String, Double, Integer>, TimeWindow>() {
                    @Override
                    public void process(Context context, Iterable<Tuple3<String, Integer, Integer>> elements, Collector<Tuple3<String, Double, Integer>> out) {
                        List<Tuple3<String, Integer, Integer>> sortedList = new ArrayList<>();
                        for (Tuple3<String, Integer, Integer> element : elements) {
                            sortedList.add(element);
                        }
                        sortedList.sort(Comparator.comparingDouble((Tuple3<String, Integer, Integer> tuple) -> calculatePopularityIndex(tuple.f1, tuple.f2)).reversed());

                        // 计算火爆指数
                        for (Tuple3<String, Integer, Integer> element : sortedList) {
                            String LocationCommunityKey = element.f0;
                            int follower = element.f1;
                            int houseCount = element.f2;
                            double popularityIndex = calculatePopularityIndex(follower, houseCount);
                            out.collect(Tuple3.of(LocationCommunityKey, popularityIndex, houseCount));
                        }
                    }
                });

        // 输出排序后的结果
        sortedPopularityStream.map(new MapFunction<Tuple3<String, Double, Integer>, Tuple3<String, Double, Integer>>() {
            @Override
            public Tuple3<String, Double, Integer> map(Tuple3<String, Double, Integer> value) throws Exception {
                logger.info("Sorted Community Popularity Data: {}" , value.toString());
                return value;
            }
        });

        String csvFileName = "/home/user/farmerj/bigdata/xmhouseprice/outputData/sortedPopularity.csv";
        sortedPopularityStream.writeAsCsv(csvFileName, FileSystem.WriteMode.OVERWRITE)
                .setParallelism(1) // 控制并行度,以确保输出结果的顺序
                .name("sortedPopularityStream CSV Sink");

        return sortedPopularityStream;
    }

    private static double calculatePopularityIndex(int followers, int houses) {
        return ALPHA * followers + BETA * houses;
}
注:由于该项目内容过多,所以只截取重要函数进行展示,详见xiamenhouseprice文件夹以查看更多详细信息。
四.数据可视化及结果分析
本实验采用Python语言,使用第三方库pyecharts作为可视化工具,其中pyecharts版本选用的是1.7.0。主要采用饼状图,柱状图和气泡图来展现数据集处理结果。
1.建立可视化工程文件
(1)新建Python文件DrawFig.py
(2)在DrawFig相同目录下创建data文件夹,将数据集处理结果放在其中
2.可视化代码
步骤:
(1)利用pandas进行csv文件的读入和将数据字段存到本地变量
(2)利用pyecharts提供的Pie,Scatter,Bar以及WordCloud等接口,用set_global_opts接口中的参数设置画出来的图像的效果(包括加粗,柱体粗细,样式)等。
(3)将画图结果用HTML的形式展示出来,并利用前端知识渲染和调整所画的图像(比如设置图像的宽,高以及按钮选取所展示的部分)。
具体代码如下:
import pandas as pd
from pyecharts.charts import WordCloud
from pyecharts import options as opts
from pyecharts.charts import Bar
from pyecharts.charts import Pie
from pyecharts.charts import Line
from pyecharts.charts import Page,Scatter
from pyecharts.charts import HeatMap
import matplotlib.pyplot as plt
import plotly.express as px
from pyecharts.commons.utils import JsCode

def draw_wordcloud(csv_file_path, output_html_path, with_title=True):
    # 读取CSV文件,并手动添加列名
    df = pd.read_csv(csv_file_path, header=None, names=['word', 'frequency'], encoding='utf-8')

    # 创建词云对象
    wordcloud = WordCloud()

    # 添加词语和频率数据
    wordcloud.add(
        series_name="Word Frequency",
        data_pair=[(word, freq) for word, freq in zip(df['word'], df['frequency'])],
        word_size_range=[10, 100],
        shape='circle'
    )

    # 设置全局选项
    if with_title:
        wordcloud.set_global_opts(
            title_opts=opts.TitleOpts(title="厦门二手房房源宣传语词频统计"),
            tooltip_opts=opts.TooltipOpts(is_show=True)
        )
    else:
        wordcloud.set_global_opts(
            tooltip_opts=opts.TooltipOpts(is_show=True)
        )

    # 渲染词云并保存为HTML文件
    wordcloud.render(output_html_path)

def draw_sorted_Word_Frequency_chart(csv_file_path, output_html_path, top_n=10):
    # 读取CSV文件,并手动添加列名
    df = pd.read_csv(csv_file_path, header=None, names=['word', 'frequency'], encoding='utf-8')

    # 按频率降序排序并取前top_n个词
    df_sorted = df.sort_values(by='frequency', ascending=False).head(top_n)

    # 创建柱状图对象
    bar = Bar()

    # 添加词语和频率数据
    bar.add_xaxis(df_sorted['word'].tolist())
    bar.add_yaxis("出现次数", df_sorted['frequency'].tolist())

    # 设置全局选项
    bar.set_global_opts(
        title_opts=opts.TitleOpts(title="高频词柱状图", title_textstyle_opts=opts.TextStyleOpts(font_weight='bold')),  # 标题加粗
        xaxis_opts=opts.AxisOpts(axislabel_opts=opts.LabelOpts(rotate=45, font_weight='bold')),  # x轴标签加粗
        yaxis_opts=opts.AxisOpts(name="频率", name_textstyle_opts=opts.TextStyleOpts(font_weight='bold')),  # y轴名称加粗
        tooltip_opts=opts.TooltipOpts(is_show=True)
    )

    # 渲染柱状图并保存为HTML文件
    bar.render(output_html_path)

def draw_total_house_of_location_chart(csv_file_path, output_html_path):
    # 读取CSV文件,并手动添加列名
    df = pd.read_csv(csv_file_path, header=None, names=['location', 'house_count'], encoding='utf-8')

    # 创建饼状图对象
    pie = Pie()

    # 添加区与房源数量数据
    pie.add(
        series_name="House Count by Location",
        data_pair=[(location, house_count) for location, house_count in zip(df['location'], df['house_count'])],
        radius=["30%", "75%"]  # 内外半径
    )

    # 设置全局选项
    pie.set_global_opts(
        title_opts=opts.TitleOpts(title="区与房源数量关系", title_textstyle_opts=opts.TextStyleOpts(font_weight='bold')),  # 标题加粗
        legend_opts=opts.LegendOpts(is_show=True, textstyle_opts=opts.TextStyleOpts(font_weight='bold')),  # 图例加粗
        tooltip_opts=opts.TooltipOpts(is_show=True)
    )

    # 设置系列选项
    pie.set_series_opts(label_opts=opts.LabelOpts(formatter="{b}: {c} ({d}%)"))

    # 渲染饼状图并保存为HTML文件
    pie.render(output_html_path)

def draw_avg_elevator_num_by_year_chart(csv_file_path, output_html_path):
    # 读取CSV文件,并手动添加列名
    df = pd.read_csv(csv_file_path, header=None, names=['year', 'avg_elevator_num', 'house_totalnum'])

    # 过滤掉值为 -1 和 1949 的行
    df = df[(df['year'] != -1) & (df['year'] != 1949)]
    df['avg_elevator_num'] = df['avg_elevator_num'].round(1)

    # 创建柱状图对象
    bar = Bar()

    # 添加柱状图数据
    bar.add_xaxis(df['year'].tolist())
    bar.add_yaxis("平均电梯数", df['avg_elevator_num'].tolist(), label_opts=opts.LabelOpts(position="top"))
    bar.add_yaxis("房源总数", df['house_totalnum'].tolist(), label_opts=opts.LabelOpts(position="top"))

    # 设置全局选项
    bar.set_global_opts(
        title_opts=opts.TitleOpts(title="建筑年份与平均梯户比关系", title_textstyle_opts=opts.TextStyleOpts(font_weight='bold')),  # 加粗
        xaxis_opts=opts.AxisOpts(name="建筑年份", axislabel_opts=opts.LabelOpts(font_weight='bold')),  # 加粗
        yaxis_opts=opts.AxisOpts(name="数量", axislabel_opts=opts.LabelOpts(font_weight='bold')),  # 加粗
        tooltip_opts=opts.TooltipOpts(is_show=True)
    )

    # 渲染柱状图并保存为HTML文件
    bar.render(output_html_path)

def draw_avg_unit_price_chart(csv_file_path, output_html_path, page_width="3000px"):

    # 读取CSV文件,并手动添加列名
    df = pd.read_csv(csv_file_path, header=None, names=['community_name', 'avg_unit_price'])

    # 对数据按照房屋均价降序排序
    df_sorted = df.sort_values(by='avg_unit_price', ascending=False)

    # 单位换算:将房屋均价转换为万元
    df_sorted['avg_unit_price'] = df_sorted['avg_unit_price'] / 10000

    # 仅选择前30个小区进行显示
    df_top30 = df_sorted.head(20)

    # 创建柱状图对象
    bar = Bar()

    # 添加柱状图数据
    bar.add_xaxis(df_top30['community_name'].tolist())
    bar.add_yaxis("房屋均价(万元)", df_top30['avg_unit_price'].round(1).tolist(),
                  label_opts=opts.LabelOpts(position="top", formatter="{c}"),
                  itemstyle_opts=opts.ItemStyleOpts(color=JsCode("""
                        function(params) {
                            var colorList = [
                                        '#FF0000', '#FF7F50', '#FF6347', '#FFD700', '#ADFF2F',
                                        '#00FF00', '#32CD32', '#00FA9A', '#00FFFF', '#00CED1',
                                        '#FF1493', '#DB7093', '#FFC0CB', '#FFA07A', '#FF8C00',
                                        '#8B0000', '#800000', '#B22222', '#DC143C', '#FF69B4',
                            ];
                            return colorList[params.dataIndex];
                        }
                    """)
                 )
                 )

    # 设置全局选项
    bar.set_global_opts(
        title_opts=opts.TitleOpts(title="小区房屋均价柱状图"),
        xaxis_opts=opts.AxisOpts(
            name="小区名称",
            axislabel_opts=opts.LabelOpts(interval=0, rotate=-25, font_weight='bold'),  # 调整柱子之间的间距
            name_textstyle_opts=opts.TextStyleOpts(font_weight='bold')  # 加粗
        ),
        yaxis_opts=opts.AxisOpts(name="房屋均价(万元)", axislabel_opts=opts.LabelOpts(font_weight='bold')),  # 加粗
        tooltip_opts=opts.TooltipOpts(is_show=True, formatter="{c} 万元"),
    )

    # 渲染柱状图
    html_content = bar.render_embed()

    # 将样式应用到 HTML 文件中
    html_content_with_style = f"""
    <html>
    <head>
    <meta charset="UTF-8">
    <meta name="viewport" content="width=device-width, initial-scale=1.0">
    <title>小区房屋均价柱状图</title>
    <style>
    .container {{
        width: {page_width};
        margin: 0 auto;
    }}
    .axis-label {{
        font-weight: bold; /* 加粗 */
    }}
    .axis-name {{
        font-weight: bold; /* 加粗 */
    }}
    </style>
    </head>
    <body>
    <div class="container">
    {html_content}
    </div>
    </body>
    </html>
    """

    # 将带样式的 HTML 内容写入文件
    with open(output_html_path, "w", encoding="utf-8") as file:
        file.write(html_content_with_style)

def draw_popularity_bubble_chart(csv_file_path, output_html_path, page_width, page_height):
    # 读取CSV文件,并手动添加列名
    df = pd.read_csv(csv_file_path, header=None, names=['community_name', 'popularity', 'total_house_count'])

    # 对数据按照受欢迎程度降序排序,并选择前15个小区
    df_sorted = df.sort_values(by='popularity', ascending=False).head(15)

    # 设置颜色列表
    colors = [
        '#FF0000', '#FF7F50', '#FF6347', '#FFD700', '#ADFF2F',
        '#00FF00', '#32CD32', '#00FA9A', '#00FFFF', '#00CED1',
        '#4682B4', '#0000FF', '#1E90FF', '#800080', '#FF00FF',
        '#FF1493', '#DB7093', '#FFC0CB', '#FFA07A', '#FF8C00',
        '#8B0000', '#800000', '#B22222', '#DC143C', '#FF69B4',
        '#FFD700', '#FFFF00', '#ADFF2F', '#7FFF00', '#7CFC00'
    ]

    # 创建气泡图对象
    scatter = Scatter()

    # 添加气泡图数据
    scatter.add_xaxis(df_sorted['community_name'].tolist())
    scatter.add_yaxis(
        series_name="受欢迎程度",
        y_axis=df_sorted['popularity'].tolist(),
        symbol_size=15,  # 固定气泡大小
        label_opts=opts.LabelOpts(is_show=False),
        itemstyle_opts=opts.ItemStyleOpts(color=JsCode("""
            function (params) {
                var colorList = [
                    '#FF0000', '#FF7F50', '#FF6347', '#FFD700', '#ADFF2F',
                    '#00FF00', '#32CD32', '#00FA9A', '#00FFFF', '#00CED1',
                    '#4682B4', '#0000FF', '#1E90FF', '#800080', '#FF00FF',
                    '#FF1493', '#DB7093', '#FFC0CB', '#FFA07A', '#FF8C00',
                    '#8B0000', '#800000', '#B22222', '#DC143C', '#FF69B4',
                    '#FFD700', '#FFFF00', '#ADFF2F', '#7FFF00', '#7CFC00'
                ];
                return colorList[params.dataIndex % colorList.length];
            }
        """))
    )

    # 设置全局选项
    scatter.set_global_opts(
        title_opts=opts.TitleOpts(title="小区受欢迎程度气泡图", title_textstyle_opts=opts.TextStyleOpts(font_weight='bold')),
        xaxis_opts=opts.AxisOpts(
            name="小区名称",
            axislabel_opts=opts.LabelOpts(interval=0, rotate=-20, font_weight='bold'),
            name_textstyle_opts=opts.TextStyleOpts(font_weight='bold'),
            splitline_opts=opts.SplitLineOpts(is_show=True, linestyle_opts=opts.LineStyleOpts(color="#FFFFFF"))
        ),
        yaxis_opts=opts.AxisOpts(
            name="受欢迎程度",
            axislabel_opts=opts.LabelOpts(font_weight='bold'),
            name_textstyle_opts=opts.TextStyleOpts(font_weight='bold'),
            splitline_opts=opts.SplitLineOpts(is_show=True, linestyle_opts=opts.LineStyleOpts(color="#FFFFFF"))
        ),
        tooltip_opts=opts.TooltipOpts(is_show=False)
    )

    # 渲染气泡图
    html_content = scatter.render_embed()

    ## 重新生成 legend_html 部分
    legend_html = """
        <h4 style="margin: 0; text-align: center;">小区名称及颜色</h4>
        <ul style="list-style: none; padding: 0; margin: 0;">
    """

    for index, row in df_sorted.iterrows():
        legend_html += f"<li><span style='background-color:{colors[index % len(colors)]}; width: 20px; height: 20px; display: inline-block;'></span> {row['community_name']}</li>"

    legend_html += """
        </ul>
    """
    scatter_width = "800px"
   # 将带样式的 HTML 内容写入文件
    html_content_with_style = f"""
    <html>
    <head>
    <meta charset="UTF-8">
    <meta name="viewport" content="width=device-width, initial-scale=1.0">
    <title>小区受欢迎程度气泡图</title>
    <style>
    .container {{
        width: {page_width};
        height: {page_height};
        margin: 0 auto;
        position: relative;
        display: flex; /* 使用 flex 布局 */
    }}
    .chart-container {{
        background: rgba(173, 216, 230, 0.9);
        padding: 20px;
        border-radius: 10px;
        border: 1px solid black; /* 添加边框属性 */
        width: {scatter_width};
        height: {page_height};
        float: left; /* 左浮动 */
    }}
    .legend-container {{
        background: rgba(173, 216, 230, 0.9);
        border-radius: 5px;
        padding: 10px;
        height: {page_height};
    }}
    </style>
    </head>
    <body>
    <div class="container">
        {html_content}
        <div class="legend-container">
            {legend_html}
        </div>
    </div>
    </body>
    </html>
    """

    # 将带样式的 HTML 内容写入文件
    with open(output_html_path, "w", encoding="utf-8") as file:
        file.write(html_content_with_style)

if __name__ == "__main__":

    draw_wordcloud(
        csv_file_path='/home/user/farmerj/bigdata/xmhouseprice/outputData/sortedWordFrequency.csv',  # 输入CSV文件路径
        output_html_path='/home/user/farmerj/bigdata/sortedWordFrequency_wordcloud.html',  # 输出HTML文件路径
        with_title=True  # 设置为 False 则不显示标题
    )
    draw_sorted_Word_Frequency_chart(
        csv_file_path='/home/user/farmerj/bigdata/xmhouseprice/outputData/sortedWordFrequency.csv',  # 输入CSV文件路径
        output_html_path='/home/user/farmerj/bigdata/sortedWordFrequency_chart.html',  # 输出HTML文件路径
        top_n=30  # 显示前30个高频词
    )
    draw_total_house_of_location_chart(
        csv_file_path='/home/user/farmerj/bigdata/xmhouseprice/outputData/TotalHouseOfLocation.csv',  # 输入CSV文件路径
        output_html_path='/home/user/farmerj/bigdata/TotalHouseOfLocation_chart.html'  # 输出HTML文件路径
    )
    draw_avg_elevator_num_by_year_chart(
        csv_file_path='/home/user/farmerj/bigdata/xmhouseprice/outputData/avgElevatorNumByYear.csv',  # 输入CSV文件路径
        output_html_path='/home/user/farmerj/bigdata/avgElevatorNumByYear_chart.html'  # 输出HTML文件路径
    )

    draw_avg_unit_price_chart(
       csv_file_path = '/home/user/farmerj/bigdata/xmhouseprice/outputData/avgUnitPriceStream.csv',
       output_html_path =  '/home/user/farmerj/bigdata/avgUnitPrice_chart.html',
       page_width="3000px"
    )

    draw_popularity_bubble_chart(
       csv_file_path = '/home/user/farmerj/bigdata/xmhouseprice/outputData/sortedPopularity.csv',
       output_html_path =  '/home/user/farmerj/bigdata/sortedPopularity_chart.html',
       page_width="1500px",
       page_height ="541.32spx"
    )
3.可视化结果
执行上述可视化代码之后,图像就会生成html网页,此时将网页传输到windows电脑上并用chrome打开就可以查看分析结果了。
(1)房源统计
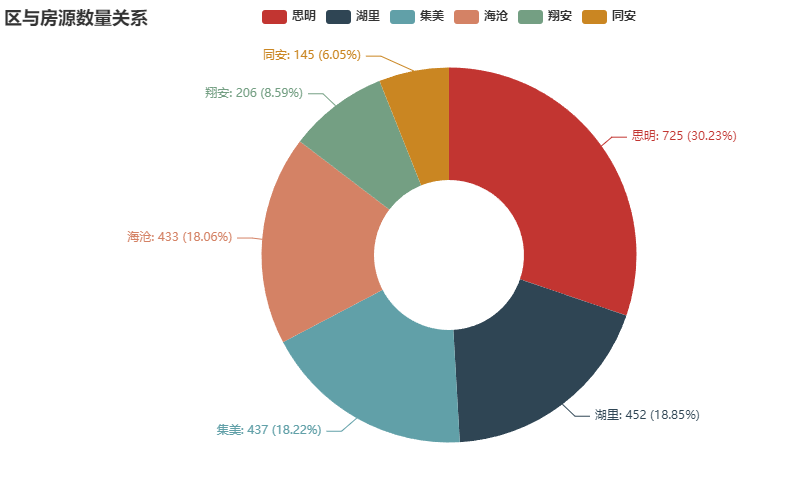
从统计结果可以看出,二手房房源最多的是思明区,最少的是同安区和翔安区。这和房地产开发情况类似,由于同安和翔安更多的是自建房和新楼房,老房子比较少,而思明区老房子最多,故思明区的房源最多。
(2)街区价格统计
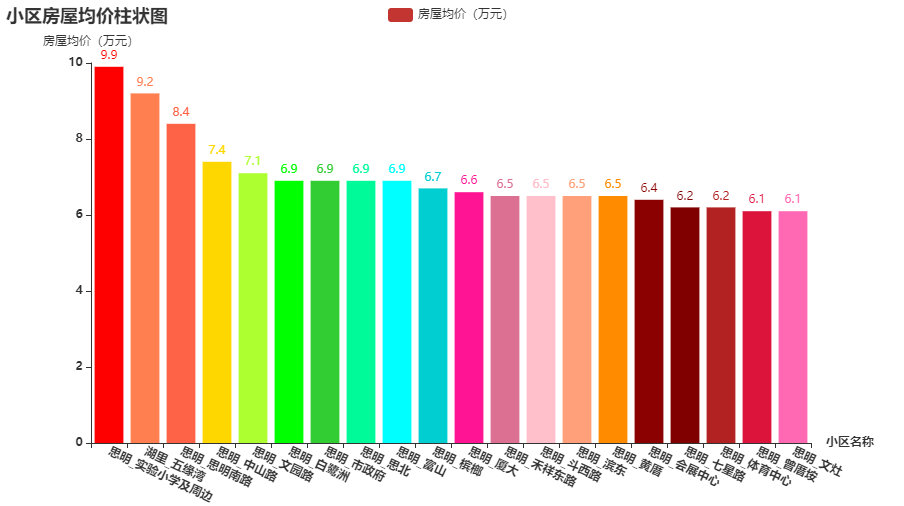
从统计结果可以看出,二手房房源街区平均房价最高的街区都位于思明区。可以看出平均房价最高的前20名的街区里大部分都来自思明(只有位于湖里区的五缘湾的房价达到前20),足以表明厦门的房价高主要体现在思明的街区的房价高。
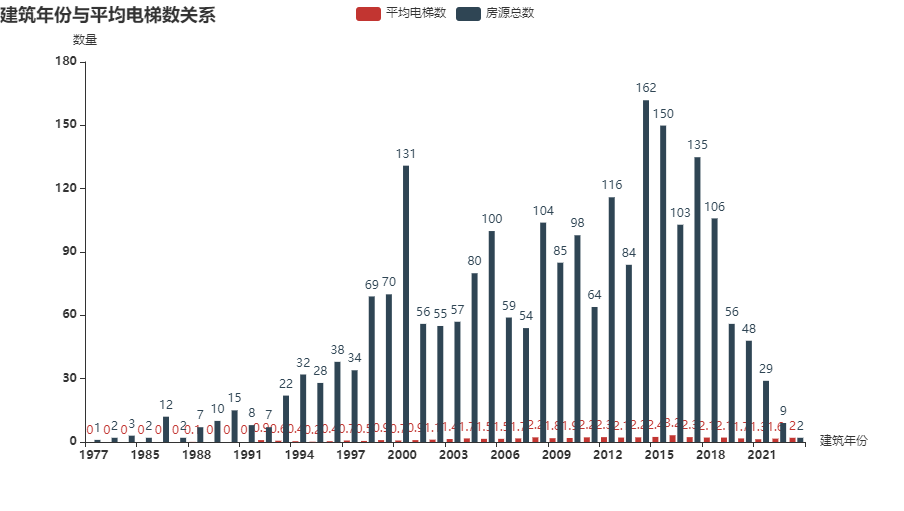
(3)建筑年份与平均电梯数间关系
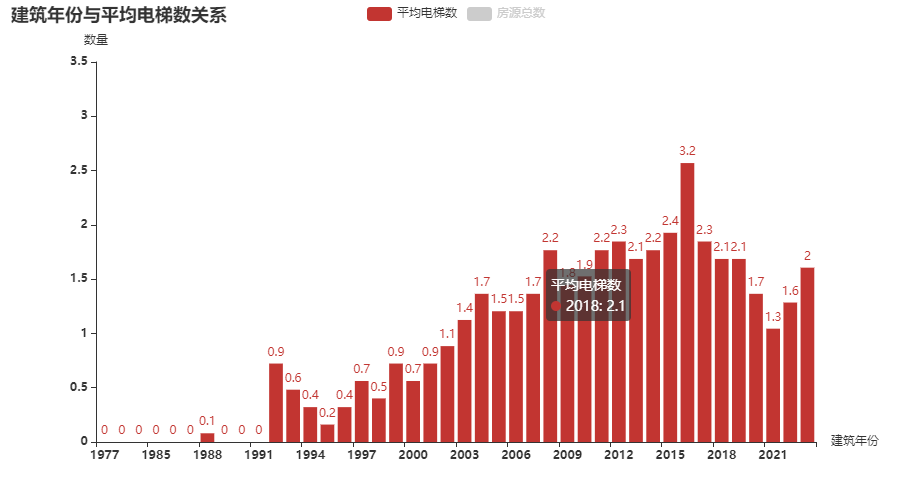
从统计结果可以看出,随着时代的发展,房源的电梯覆盖率逐渐提升。并且在房地产发展蓬勃发展的2009-2015年,房源的电梯数量达到了较高值。其背后的原因可以猜测是公寓型住宅的大量建设,导致每层楼有很多户,从而导致电梯数量较多。

从统计结果可以看出,在2014-2018年的房源数最多。
(4)词频统计

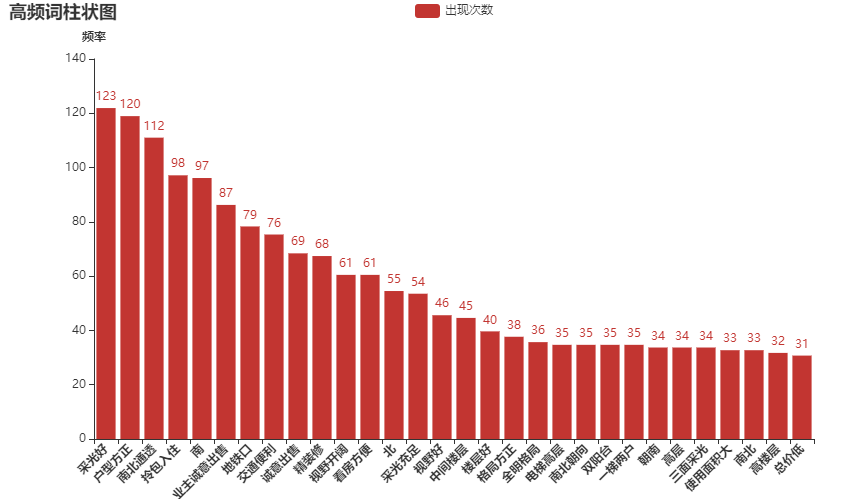
通过统计宣传语中的词频,可以发现在宣传房屋时“采光”,“通风”,“交通便利程度”和“装修情况”是购房者在买房的时候着重会考虑的因素。下列的柱状图也佐证了以上情况。
(5)小区受欢迎程度
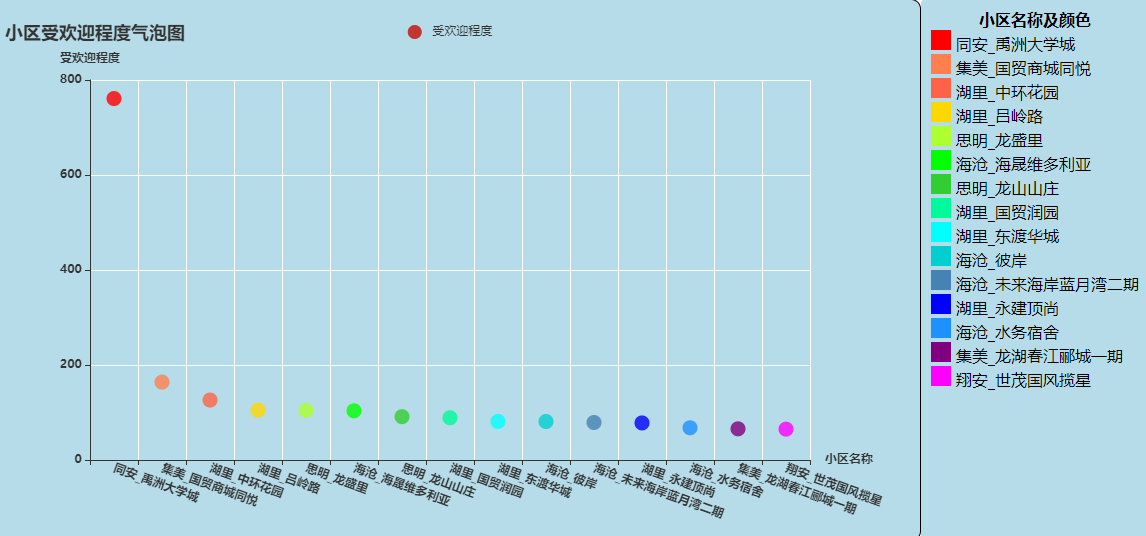
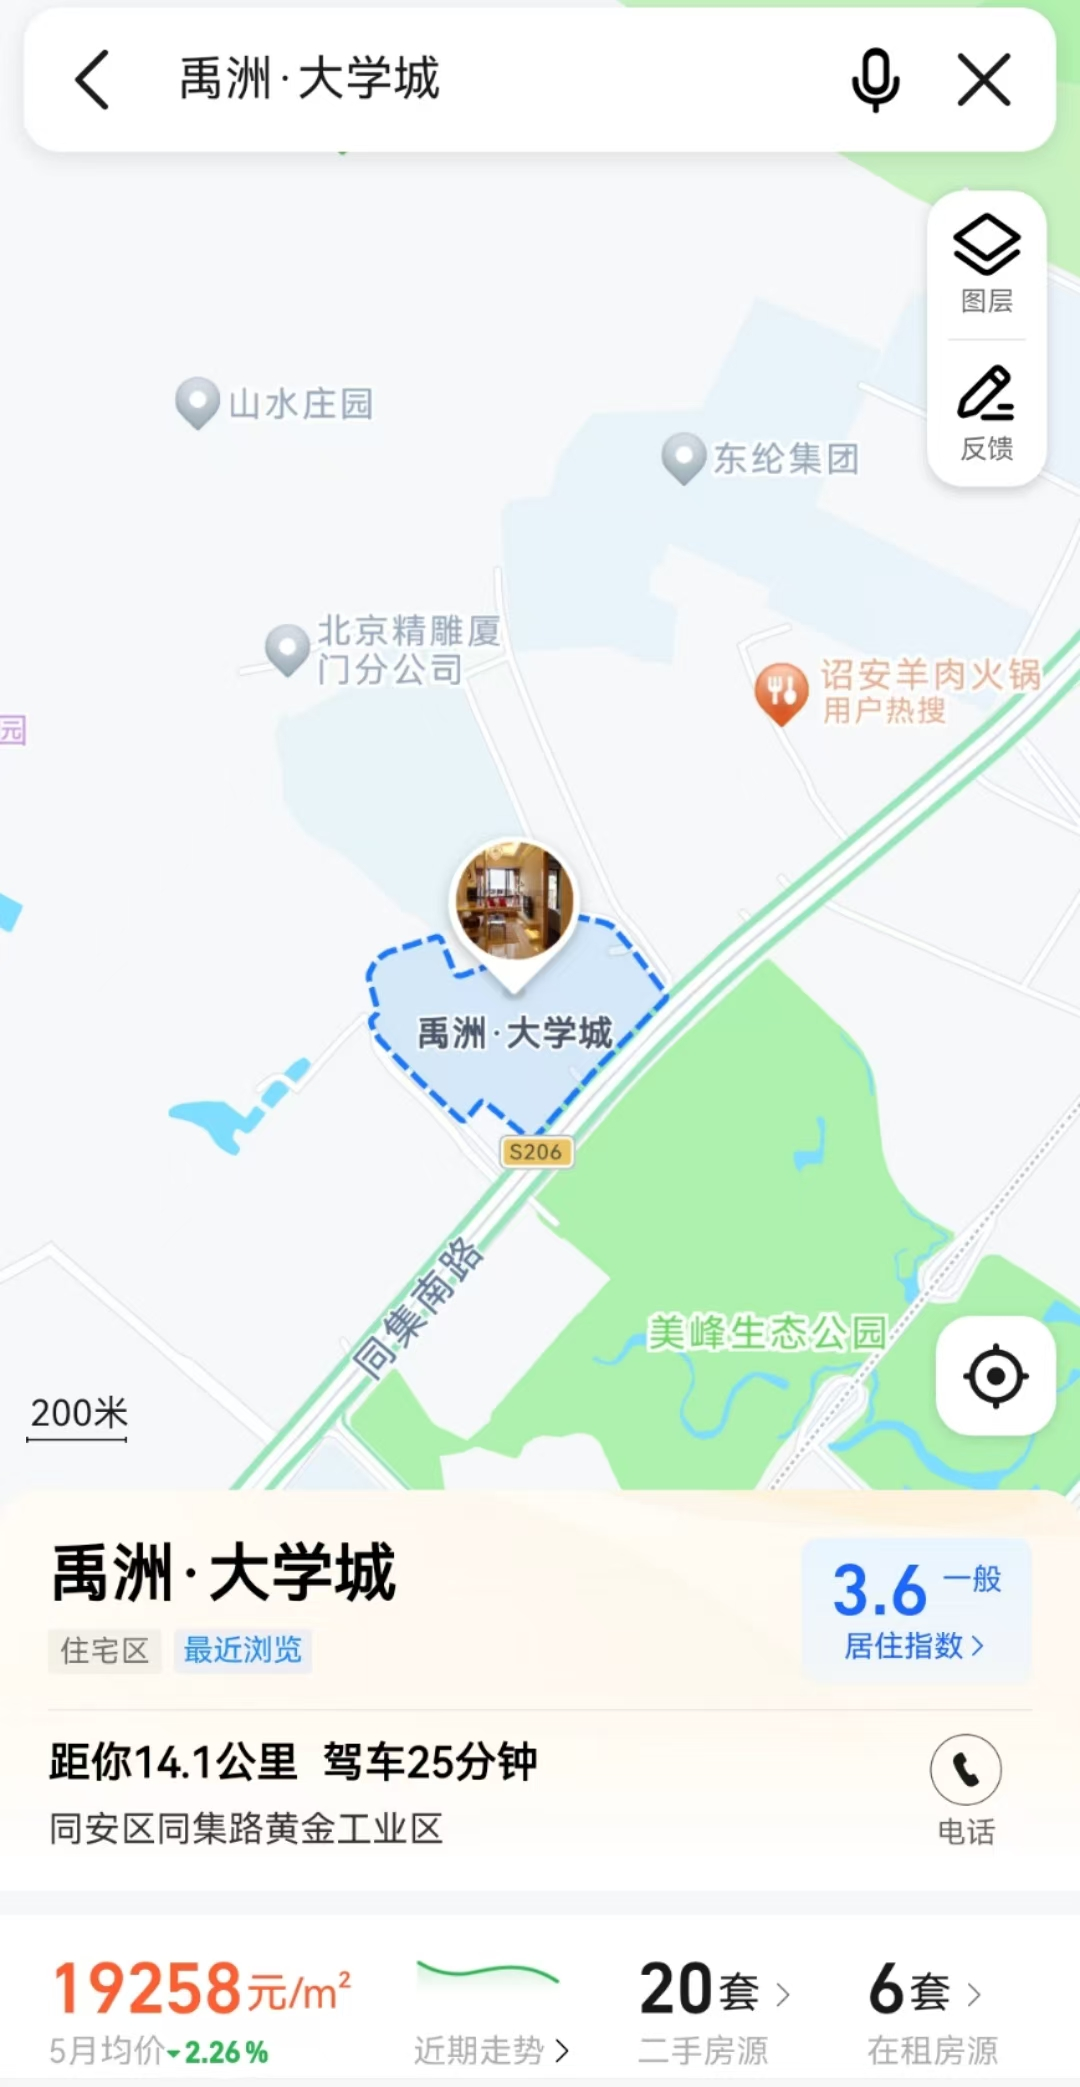
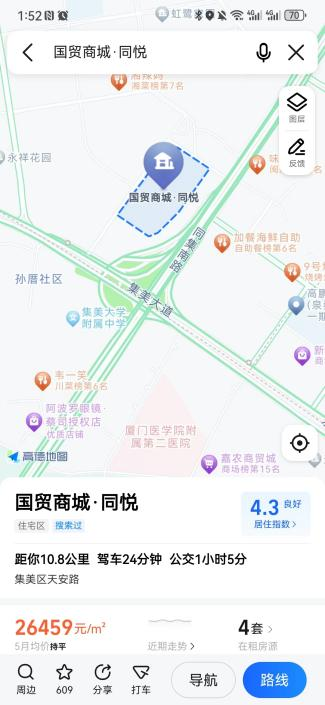
通过观察气泡图可以发现同安的禹州大学城楼盘的受欢迎程度远超其他楼盘。但是打开地图可以发现该房地产开发区周围配套设施不好,所以房价一路走低。而受欢迎程度第二和第三的楼盘周边配套设施较为完善。
