D3 的全称是(Data-Driven Documents),顾名思义可以知道是一个被数据驱动的文档。听名字有点抽象,说简单一点,其实就是一个 JavaScript 的函数库,使用它主要是用来做数据可视化的。本教程主要介绍D3一些最基本的使用方法,以及生成一些比较简单的图表。学习 D3 最好的地方是:http://d3js.org/ 。
D3可视化库的安装
D3 是一个 JavaScript 函数库,并不需要通常所说的“安装”。它只有一个文件,在 HTML 中引用即可。有两种方法:
- 下载 D3.js 的文件
解压后,在 HTML 文件中包含相关的 js 文件即可。 -
还可以直接包含网络的链接,这种方法较简单:
<script src="http://d3js.org/d3.v3.min.js" charset="utf-8"></script>
但使用的时候要保持网络连接有效,不能在断网的情况下使用。
预备知识
学习D3可视化库需要的一些基础知识如下:
- HTML:超文本标记语言,用于设定网页的内容
- CSS:层叠样式表,用于设定网页的样式
- JavaScript:一种直译式脚本语言,用于设定网页的行为
- DOM:文档对象模型,用于修改文档的内容和结构
- SVG:可缩放矢量图形,用于绘制可视化的图形
基本操作
1、添加元素
d3.select("body").append("p").text("New paragraph!");
为选择body标签,为之添加一个p标签,并设置它的内容为New paragraph!
源代码:
<html>
    <head>
        <meta charset="utf-8">
       <title>D3测试</title>
       <script type="text/javascript" src="http://d3js.org/d3.v3.min.js"> </script>
    </head>
    <body>
    <script type="text/javascript">
           d3.select("body").append("p").text("New paragraph!");
    </script>
    </body>
</html>
效果:
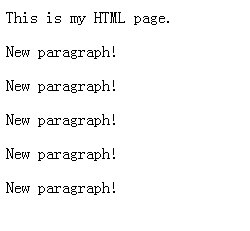
2、数据绑定
D3可以处理哪些类型的数据?
它会接受几乎任何数字数组,字符串,或对象(本身包含其他数组或键/值对)。它可以处理JSON和GeoJSON
源代码:
<!DOCTYPE html>
<html>
  <head>
    <title>testD3-1.html</title>
    <script type="text/javascript" src="http://d3js.org/d3.v3.min.js"></script>
  </head>

  <body>
    This is my HTML page. <br>
  </body>
  <script type="text/javascript">
  var dataset = [ 5, 10, 15, 20, 25 ];

  d3.select("body").selectAll("p")
    .data(dataset)
    .enter()
    .append("p")
    .text("New paragraph!");
  </script>
</html>
语法说明:
- d3.select("body")
查找DOM中的body。 -
selectAll("p")
选择DOM中的所有段落。由于没有存在,这将返回一个空的选择。这个选择为空,代表段落很快就会存在。 -
data(dataset)
计数和分析我们的数据值。有五个值,之后我们的数据集执行了5次,每个值一次。 -
enter()
绑定数据和DOM元素。这个方法将数据传递到DOM中。如果数据值比相应的DOM元素多,就用enter()创建一个新元素的占位符。 -
append("p")
通过enter()创建的占位符 在DOM中插入一个p元素。 -
text("New paragraph!")
为新创建的p标签插入一个文本值。
效果:
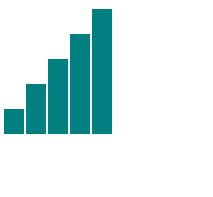
3、用层画条形图
(1)、为同类层添加样式
div.bar {
    display: inline-block;
    width: 20px;
    height: 75px;   /* We'll override this later */
    background-color: teal;
}
(2)、声明要为某类层设置属性
.attr("class", "bar")
(3)、为每个特定的层设置属性
.style("height", function(d) {
    var barHeight = d * 5;  //Scale up by factor of 5
    return barHeight + "px";
});
(4)、设置层之间的间隔
margin-right: 2px;
源代码:
<!DOCTYPE html>
<html>
  <head>
        <meta charset="utf-8">
        <title>testD3-3-drawingDivBar</title>
        <script type="text/javascript" src="http://d3js.org/d3.v3.min.js"> </script>
    <style type="text/css">

            div.bar {
                display: inline-block;
                width: 20px;
                height: 75px;   /* Gets overriden by D3-assigned height below */
                margin-right: 2px;
                background-color: teal;
            }

        </style>
    </head>
    <body>
        <script type="text/javascript">

            var dataset = [ 5, 10, 15, 20, 25 ];

            d3.select("body").selectAll("div")
                .data(dataset)
                .enter()
                .append("div")
                .attr("class", "bar")
                .style("height", function(d) {
                    var barHeight = d * 5;
                    return barHeight + "px";
                });

        </script>
    </body>
</html>
效果
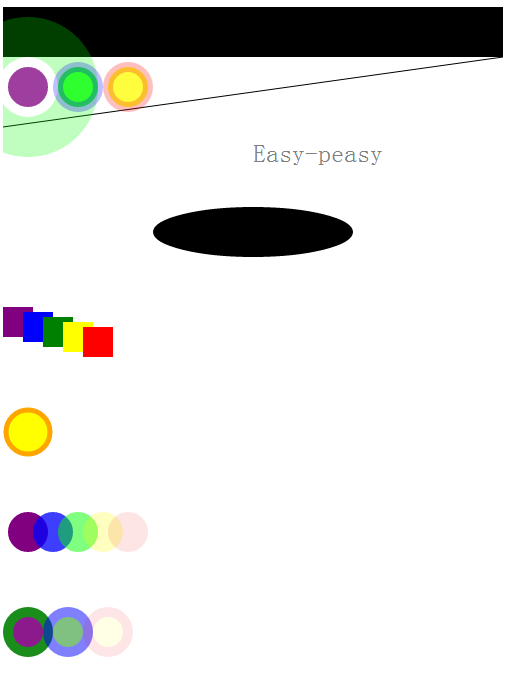
4、SVG概要
(1)、简单形状
SVG标签包含一些视觉元素,包括矩形,圆形,椭圆形,线条,文字和路径等。
基于像素的坐标系统,其中浏览器的左上角是原点(0,0)。x,y的正方向分别是右和下。
矩形。使用x和y的指定左上角的坐标,width和height指定的尺寸。绘制SVG的矩形可以这样写:
<rect x="0" y="0" width="500" height="50"/>
圆。使用cx和cy,指定指定半径的中心的坐标,和ŗ表示半径。例如:
<circle cx="250" cy="25" r="25"/>
椭圆。使用cx和cy,指定指定半径的中心的坐标,rx和ry分别指定x方向和y方向上圆的半径,例如:
<ellipse cx="250" cy="25" rx="100" ry="25"/>
线。使用x1和Y1到指定线的一端的坐标,x2和y2指定的另一端的坐标。stroke指定描边使得线是可见的。例如:
<line x1="0" y1="0" x2="500" y2="50" stroke="black"/>
文本。使用 x和y指定文本的位置。例如:
1. <text x="250" y="25">Easy-peasy</text>
可以给文本设置样式。例如:
<text x="250" y="155" font-family="sans-serif" font-size="25" fill="gray">Easy-peasy</text>
(2)、SVG的默认样式
SVG的默认样式没有中风是黑色填充。如果你想别的,你就必须将样式应用到你的元素。常见的SVG性质:
1. 填充(fill) -颜色值。正如用CSS,颜色可以被指定为
* 命名的颜色- green
* 十六进制值- #3388aa或38A
* RGB值- RGB(10,150,20)
* RGB与Alpha透明度- RGBA(10,150,20,0.5)
2. 描边(stroke) -颜色值。
3. 描边宽度(stroke-width) -数字(通常以像素为单位)。
4. 不透明度(opacity) - 0.0(完全透明)和1.0(完全不透明)之间的数值。
5. 有了文字,也可以使用CSS样式,如:
* 字体家庭(font-family)
* 字体大小(font-size)
源代码:
<!DOCTYPE html>
<html>
  <head>
    <meta charset="utf-8">
    <title>testD3-6-SVG.html</title>
    <script type="text/javascript" src="http://d3js.org/d3.v3.min.js"></script>
    <style type="text/css">
        .pumpkin {
            fill: yellow;
           stroke: orange;
               stroke-width: 5;
       }
   </style>
   </head>
   <body>
   <script type="text/javascript"></script>
   <svg width=500 height=960>
       <rect x="0" y="0" width="500" height="50"/>
       <ellipse cx="250" cy="225" rx="100" ry="25"/>
       <line x1="0" y1="120" x2="500" y2="50" stroke="black"/>
       <text x="250" y="155" font-family="sans-serif"
               font-size="25" fill="gray">Easy-peasy</text>
       <circle cx="25" cy="80" r="20"
               fill="rgba(128, 0, 128, 0.75)"
               stroke="rgba(0, 255, 0, 0.25)"
               stroke-width="100"/>
       <circle cx="75" cy="80" r="20"
               fill="rgba(0, 255, 0, 0.75)"
               stroke="rgba(0, 0, 255, 0.25)" stroke-width="10"/>
       <circle cx="125" cy="80" r="20"
               fill="rgba(255, 255, 0, 0.75)"
               stroke="rgba(255, 0, 0, 0.25)" stroke-width="10"/>
       <rect x="0" y="300" width="30" height="30" fill="purple"/>
       <rect x="20" y="305" width="30" height="30" fill="blue"/>
       <rect x="40" y="310" width="30" height="30" fill="green"/>
       <rect x="60" y="315" width="30" height="30" fill="yellow"/>
       <rect x="80" y="320" width="30" height="30" fill="red"/>
       <circle cx="25" cy="425" r="22" class="pumpkin"/>
       <circle cx="25" cy="525" r="20" fill="rgba(128, 0, 128, 1.0)"/>
       <circle cx="50" cy="525" r="20" fill="rgba(0, 0, 255, 0.75)"/>
       <circle cx="75" cy="525" r="20" fill="rgba(0, 255, 0, 0.5)"/>
       <circle cx="100" cy="525" r="20" fill="rgba(255, 255, 0, 0.25)"/>
       <circle cx="125" cy="525" r="20" fill="rgba(255, 0, 0, 0.1)"/>
       <circle cx="25" cy="625" r="20" fill="purple"
               stroke="green" stroke-width="10"
               opacity="0.9"/>
       <circle cx="65" cy="625" r="20" fill="green"
               stroke="blue" stroke-width="10"
               opacity="0.5"/>
       <circle cx="105" cy="625" r="20" fill="yellow"
               stroke="red" stroke-width="10"
               opacity="0.1"/>
   </svg>
   </body>
</html>
效果:
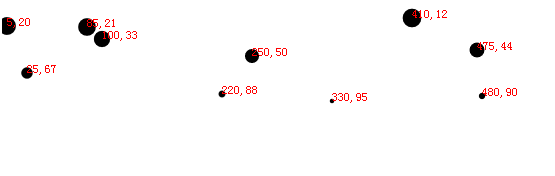
5、散点图
(1)、一般的散点绘制
用二维数组表示每个点的坐标
//Width and height
var w = 500;
var h = 100;

var dataset = [
   [5, 20], [480, 90], [250, 50], [100, 33], [330, 95],
   [410, 12], [475, 44], [25, 67], [85, 21], [220, 88]
   ];

//Create SVG element
var svg = d3.select("body")
    .append("svg")
    .attr("width", w)
    .attr("height", h);

    svg.selectAll("circle")
    .data(dataset)
    .enter()
    .append("circle")
    .attr("cx", function(d) {
        return d[0];
    })
    .attr("cy", function(d) {
        return d[1];
    })
    .attr("r", 5);
(2)、点的大小
控制半径
.attr("r", function(d) {
  return Math.sqrt(h - d[1]);
});
(3)、点的文本
注意文本的位置与圆中心的位置
svg.selectAll("text")
    .data(dataset)
    .enter()
    .append("text")
    .text(function(d) {
        return d[0] + "," + d[1];
    })
    .attr("x", function(d) {
        return d[0];
   })
   .attr("y", function(d) {
       return d[1];
   })
   .attr("font-family", "sans-serif")
   .attr("font-size", "11px")
   .attr("fill", "red");
源代码:
<!DOCTYPE html>
<html>
  <head>
        <meta charset="utf-8">
        <title>testD3-9-drawScatterLot.html</title>
        <script type="text/javascript" src="http://d3js.org/d3.v3.min.js"></script>
    <style type="text/css">
        </style>
    </head>
   <body>
       <script type="text/javascript">
           //Width and height
           var w = 600;
           var h = 100;

           var dataset = [
                           [5, 20], [480, 90], [250, 50], [100, 33], [330, 95],
                           [410, 12], [475, 44], [25, 67], [85, 21], [220, 88]
                         ];

           //Create SVG element
           var svg = d3.select("body")
                       .append("svg")
                       .attr("width", w)
                       .attr("height", h);

           svg.selectAll("circle")
              .data(dataset)
              .enter()
              .append("circle")
              .attr("cx", function(d) {
                   return d[0];
              })
              .attr("cy", function(d) {
                   return d[1];
              })
              .attr("r", function(d) {
                   return Math.sqrt(h - d[1]);
              });

           svg.selectAll("text")
              .data(dataset)
              .enter()
              .append("text")
              .text(function(d) {
                   return d[0] + "," + d[1];
              })
              .attr("x", function(d) {
                   return d[0];
              })
              .attr("y", function(d) {
                   return d[1];
              })
              .attr("font-family", "sans-serif")
              .attr("font-size", "11px")
              .attr("fill", "red");
       </script>

   </body>
</html>
效果: