【版权声明】版权所有,严禁转载,严禁用于商业用途,侵权必究。
作者:厦门大学信息学院计算机科学系2018级研究生 陈兆彬
指导老师:厦门大学数据库实验室 林子雨 博士/副教授
相关教材:林子雨、郑海山、赖永炫编著《Spark编程基础(Python版)》(访问教材官网)
相关案例:基于Python语言的Spark数据处理分析案例集锦(PySpark)
本实验采用Python语言,从网页爬取气象数据,并使用大数据处理框架Spark对气象数据进行处理分析,并对分析结果进行可视化。
一、实验环境
(1)Linux: Ubuntu 16.04
(2)Python: 3.6
(3)Spark: 2.4.0 (查看安装教程)
(4)Jupyter Notebook (查看安装和使用方法教程)
安装完上述环境以后,为了支持Python可视化分析,还需要执行如下命令安装新的组件:
pip install matplotlib
sudo apt-get install python3-tk
本实验涉及到的所有数据集和代码,可以从百度网盘下载(下载地址,提取码:3hdm)。
二、实验数据介绍
本次实验所采用的数据,从中央气象台官方网站(网址:http://www.nmc.cn/)爬取,主要是最近24小时各个城市的天气数据,包括时间点(整点)、整点气温、整点降水量、风力、整点气压、相对湿度等。正常情况下,每个城市会对应24条数据(每个整点一条)。数据规模达到2412个城市,57888条数据,有部分城市部分时间点数据存在缺失或异常。限于本次大作业时间有限,没有办法全面分析这些数据,大作业中主要计算分析了各个城市过去24小时的平均气温和降水量情况。
特别说明:实验所用数据均为网上爬取,没有得到中央气象台官方授权使用,使用范围仅限本次实验使用,请勿用于商业用途。
三、数据获取
1.观察数据获取方式
打开中央气象台官方网站(网址:http://www.nmc.cn/),任意点击左侧栏“热点城市”中的一个城市。打开火狐(Firefox)浏览器或者谷歌(chrome)浏览器的Web控制台。通过切换“省份”和“城市”,我们可以发现,网页中的数据是以json字符串格式异步地从服务器传送。可以发现以下数据和请求URL的关系。
请求URL 传回数据
http://www.nmc.cn/f/rest/province 省份数据
http://www.nmc.cn/f/rest/province/+省份三位编码 某个省份的城市数据
http://www.nmc.cn/f/rest/passed/+城市编号 某个城市最近24小时整点天气数据
由于省份三位编码(如福建省编码为“ABJ”)需要从省份数据获得中获得,城市编号需要从城市数据获得(如福州市编号为“58847”),所以为了获得各个城市最近24小时整点天气数据,依次爬取省份数据、城市数据、最近24小时整点数据。
2.数据爬取
由于可以直接通过访问请求URL,传回的响应的数据部分即是json格式的数据,所以只需要调用python的urllib2库中相关函数,对上述URL进行请求即可。不需要像平常爬取HTML网页时还需要对网页源码进行解析,查找相关数据。唯一需要注意的是,有些城市可能不存在或者全部缺失最近24小时整点数据,需要进行过滤,以免出错。
3.数据存储
虽然上一步获取的json数据可以直接存储并可使用SparkSession直接读取,但是为了方便观察数据结构、辨识异常数据、对数据增加部分提示信息,爬取后的数据进行了一些处理之后,保存成了csv格式,包括省份数据(province.csv)、城市数据(city.csv)、各个城市最近24小时整点天气数据(passed_weather_ALL.csv)。由于所有城市过去24小时整点天气数据数量太多,为了避免内存不足,每爬取50个城市的数据后,就会进行一次保存。
4. 数据读取
因为各个城市最近24小时整点天气数据体量较大,每次爬取需要半小时以上,为了提高实验效率,只会进行一次数据爬取。此后会直接读取第一次实验数据。如果需要重新爬取数据,需要手动删除已有数据,即删除input文件夹下province.csv、city.csv、passed_weather_ALL.csv。
5.数据结构
最后保存的各个城市最近24小时整点天气数据(passed_weather_ALL.csv)每条数据各字段含义如下所示,这里仅列出实验中使用部分。
字段 含义
province 城市所在省份(中文)
city_index 城市序号(计数)
city_name 城市名称(中文)
city_code 城市编号
time 时间点(整点)
temperature 气温
rain1h 过去1小时降雨量
6.爬虫源代码
完成上述数据集获取操作的数据爬虫的源代码如下:
#coding:utf-8
import urllib2
import json
import csv
import chardet
import codecs
import os
import time

import sys
reload(sys)
sys.setdefaultencoding('utf8')

class Crawler:
    def get_html(self,url):
        #url = 'http://www.nmc.cn/f/rest/province'
        request = urllib2.Request(url)
        response = urllib2.urlopen(request)
        return response.read()
    def parse_json(self,url):
        obj = self.get_html(url)
        if obj:
            json_obj = json.loads(obj)
        else:
            json_obj = list()
        # print json_obj
        # for obj in json_obj:
        #     print obj
            #print chardet.detect(obj['name'])
        return json_obj
        # soup = BeautifulSoup(html_doc,"html.parser",from_encoding='utf-8')
        # links = soup.find_all('a')
        # print "all links"
        # for link in links:
        #     print link.name,link['href']

    def write_csv(self,file,data):
        if data:
            print "begin to write to " + file
            with open(file,'ab+') as f:
                f.write(codecs.BOM_UTF8)
                f_csv = csv.DictWriter(f,data[0].keys())
                if not os.path.exists(file):
                    f_csv.writeheader()
                f_csv.writerows(data)
            print "end to write to " + file

    def write_header(self,file,data):
        if data:
            print "begin to write to " + file
            with open(file,'ab+') as f:
                f.write(codecs.BOM_UTF8)
                f_csv = csv.DictWriter(f,data[0].keys())
                f_csv.writeheader()
                f_csv.writerows(data)
            print "end to write to " + file

    def write_row(self,file,data):
        if data:
            print "begin to write to " + file
            with open(file,'ab+') as f:
                f.write(codecs.BOM_UTF8)
                f_csv = csv.DictWriter(f,data[0].keys())
                # f_csv.writeheader()
                f_csv.writerows(data)
            print "end to write to " + file

    def read_csv(self,file):
        print "begin to read " + file
        with open(file,'rb') as f:
            data = csv.DictReader(f)
            print "end to read " + file
            return list(data)

    def get_provinces(self):
        province_file = 'input/province.csv'
        if not os.path.exists(province_file):
            print "begin crawl province"
            provinces = self.parse_json('http://www.nmc.cn/f/rest/province')
            print "end crawl province"
            self.write_csv(province_file,provinces)
        else:
            provinces = self.read_csv(province_file)
        return provinces

    def get_cities(self):
        city_file = 'input/city.csv'
        if not os.path.exists(city_file):
            cities = list()
            print "begin crawl city"
            for province in self.get_provinces():
                print province['name']
                url = province['url'].split('/')[-1].split('.')[0]
                cities.extend(self.parse_json('http://www.nmc.cn/f/rest/province/'+url))
            self.write_csv(city_file,cities)
            print "end crawl city"
        else:
            cities = self.read_csv(city_file)
        return cities

    def get_passed_weather(self,province):
        weather_passed_file = 'input/passed_weather_' + province + '.csv'
        if os.path.exists(weather_passed_file):
            return
        passed_weather = list()
        count = 0
        if province == 'ALL':
            print "begin crawl passed weather"
            for city in self.get_cities():
                print city['province'] + ' ' + city['city'] + ' ' + city['code']
                data = self.parse_json('http://www.nmc.cn/f/rest/passed/'+city['code'])
                if data:
                    count = count + 1
                    for item in data:
                        item['city_code'] = city['code']
                        item['province'] = city['province']
                        item['city_name'] = city['city']
                        item['city_index'] = str(count)
                    passed_weather.extend(data)
                time.sleep(1)
                if count % 50 == 0:
                    if count == 50:
                        self.write_header(weather_passed_file,passed_weather)
                    else:
                        self.write_row(weather_passed_file,passed_weather)
                    passed_weather = list()
            if passed_weather:
                if count <= 50:
                    self.write_header(weather_passed_file,passed_weather)
                else:
                    self.write_row(weather_passed_file,passed_weather)
            print "end crawl passed weather"
        else:
            print "begin crawl passed weather"
            select_city = filter(lambda x:x['province']==province,self.get_cities())
            for city in select_city:
                print city['province'] + ' ' + city['city'] + ' ' + city['code']
                data = self.parse_json('http://www.nmc.cn/f/rest/passed/'+city['code'])
                if data:
                    count = count + 1
                    for item in data:
                        item['city_index'] = str(count)
                        item['city_code'] = city['code']
                        item['province'] = city['province']
                        item['city_name'] = city['city']
                    passed_weather.extend(data)
                #time.sleep(1)
            self.write_csv(weather_passed_file,passed_weather)
            print "end crawl passed weather"

    def run(self,range = 'ALL'):
        self.get_passed_weather(range)

# if __name__ == '__main__':
#     main()
四、数据分析
数据分析主要使用Spark SQL相关知识与技术,对各个城市过去24小时累积降雨量和当日平均气温进行了计算和排序。
1. 计算各个城市过去24小时累积雨量
思路:按照城市对数据进行分组,对每个城市的rain1h字段进行分组求和。
特别说明:由于获取数据所需时间较长,天气数据的时间跨度可能略有不一致,这里为了简化操作没有筛选出具有相同时间跨度的数据再进行计算。
相关步骤如下:
(1)创建SparkSession对象spark;
(2)使用spark.read.csv(filename)读取passed_weather_ALL.csv数据生成Dateframe df;
(3)对df进行操作:使用Dateframe的select方法选择province,city_name,city_code,rain1h字段,并使用Column对象的cast(dateType)方法将rain1h转成数值型,再使用Dateframe的filter方法筛选出rain1h小于1000的记录(大于1000是异常数据),得到新的Dateframe df_rain;
(4)对df_rain进行操作:使用Dateframe的groupBy操作按照province,city_name,city_code的字段分组,使用agg方法对rain1h字段进行分组求和得到新的字段rain24h(过去24小时累积雨量),使用sort方法按照rain24h降序排列,经过上述操作得到新的Dateframe df_rain_sum
(5)对df_rain_sum调用cache()方法将此前的转换关系进行缓存,提高性能
(6)对df_rain_sum调用coalesce()将数据分区数目减为1,并使用write.csv(filename)方法将得到的数据持久化到本地文件。
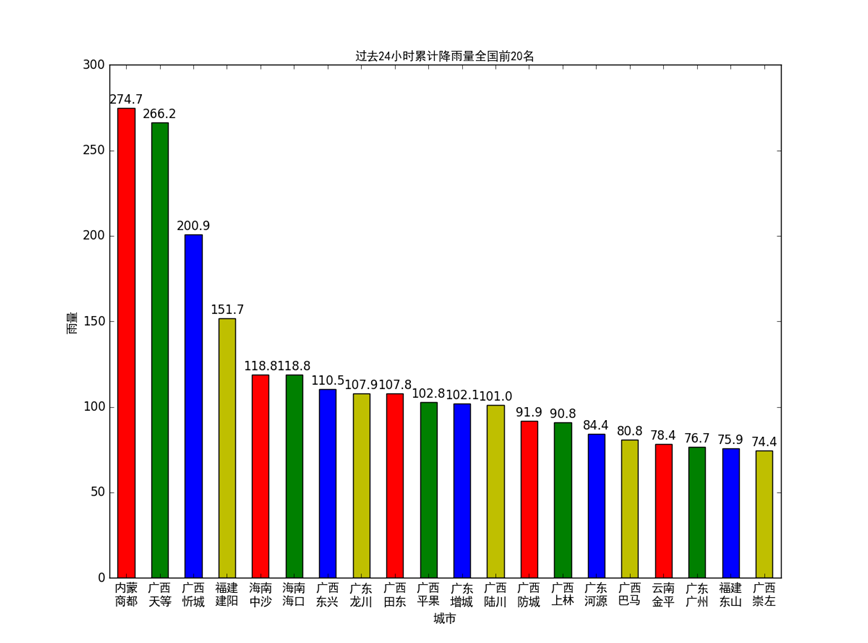
(7)对df_rain_sum调用head()方法取前若干条数据(即24小时累积降水量Top-N的列表)供数据可视化使用。
本部分分析对应的具体代码如下:
def passed_rain_analyse(filename): #计算各个城市过去24小时累积雨量
    print "begin to analyse passed rain"
    spark = SparkSession.builder.master("local").appName("passed_rain_analyse").getOrCreate()
    df = spark.read.csv(filename,header = True)
    df_rain = df.select(df['province'],df['city_name'],df['city_code'],df['rain1h'].cast(DecimalType(scale=1)))\
        .filter(df['rain1h'] < 1000) #筛选数据,去除无效数据
    df_rain_sum = df_rain.groupBy("province","city_name","city_code")\
        .agg(F.sum("rain1h").alias("rain24h"))\
        .sort(F.desc("rain24h")) # 分组、求和、排序
    df_rain_sum.cache()
    df_rain_sum.coalesce(1).write.csv("file:///home/zhaobin/bigData/passed_rain_analyse.csv")
    print "end analysing passed rain"
    return df_rain_sum.head(20)
2.计算各个城市当日平均气温
思路:根据国家标准(《地面气象服务观测规范》),日平均气温取四时次数据的平均值,四时次数据为:02时、08时、14时、20时。据此,应该先筛选出各个时次的气温数据,再按照城市对数据进行分组,对每个城市的tempeature字段进行分组求平均。
特别说明:为了能获取到上述一天的四个时次的天气数据,建议在当天的20时30分后再爬取数据。
相关步骤如下:
(1)创建SparkSession对象spark;
(2)使用spark.read.csv(filename)读取passed_weather_ALL.csv数据生成Dateframe df;
(3)对df进行操作:使用Dateframe的select方法选择province,city_name,city_code,temperature字段,并使用库pyspark.sql.functions中的date_format(col,pattern)方法和hour(col)将time字段转换成date(日期)字段和hour(小时)字段,(time字段的分秒信息无用),,得到新的Dateframe df_temperature;
(4)对df_temperature进行操作:使用Dateframe的filter操作过滤出hour字段在[2,8,14,20]中的记录,经过上述操作得到新的Dateframe df_4point_temperature
(5)对df_4point_temperature进行操作:使用Dateframe的groupBy操作按照province,city_name,city_code,date字段分组,使用agg方法对temperature字段进行分组计数和求和(求和字段命名为avg_temperature),使用filter方法过滤出分组计数为4的记录(确保有4个时次才能计算日平均温),使用sort方法按照avg_temperature降序排列,再筛选出需要保存的字段province,city_name,city_code,date,avg_temperature(顺便使用库pyspark.sql.functions中的format_number(col, precision)方法保留一位小数),经过上述操作得到新的Dateframe df_avg_temperature
(6)对df_avg_temperature调用cache()方法将此前的转换关系进行缓存,提高性能
(7)对df_avg_temperature调用coalesce()将数据分区数目减为1,并使用write.json(filename)方法将得到的数据持久化到本地文件。
(8)对df_rain_sum调用collect()方法取将Dateframe转换成list,方便后续进行数据可视化。
本部分分析对应的具体代码如下:
def passed_temperature_analyse(filename):
    print "begin to analyse passed temperature"
    spark = SparkSession.builder.master("local").appName("passed_temperature_analyse").getOrCreate()
    df = spark.read.csv(filename,header = True)
    df_temperature = df.select( #选择需要的列
            df['province'],
            df['city_name'],
            df['city_code'],
            df['temperature'].cast(DecimalType(scale=1)),
            F.date_format(df['time'],"yyyy-MM-dd").alias("date"), #得到日期数据
            F.hour(df['time']).alias("hour") #得到小时数据
    )
    # 筛选四点时次
    df_4point_temperature = df_temperature.filter(df_temperature['hour'].isin([2,8,12,20]))
    #df_4point_temperature.printSchema()
    df_avg_temperature = df_4point_temperature.groupBy("province","city_name","city_code","date")\
        .agg(F.count("temperature"),F.avg("temperature").alias("avg_temperature"))\
        .filter("count(temperature) = 4")\
        .sort(F.asc("avg_temperature"))\
        .select("province","city_name","city_code","date",F.format_number('avg_temperature',1).alias("avg_temperature"))
    df_avg_temperature.cache()
    avg_temperature_list = df_avg_temperature.collect()
    df_avg_temperature.coalesce(1).write.json("file:///home/zhaobin/bigData/passed_rain_temperature.json")
    print "end analysing passed temperature"
    return avg_temperature_list[0:10]
五、数据可视化
数据可视化使用python matplotlib库,版本号1.5.1。可使用pip命令安装。
绘制过程大体如下:
第一步,应当设置字体,这里提供了黑体的字体文件simhei.tff。否则坐标轴等出现中文的地方是乱码。
第二步,设置数据(累积雨量或者日平均气温)和横轴坐标(城市名称),配置直方图。
第三步,配置横轴坐标位置,设置纵轴坐标范围
第四步,配置横纵坐标标签
第五步,配置每个条形图上方显示的数据
第六步,根据上述配置,画出直方图。
画图部分对应的源代码如下:
def draw_rain(rain_list):
    print "begin to draw the picture of passed rain"
    font = FontProperties(fname='ttf/simhei.ttf') # 设置字体
    name_list = []
    num_list = []
    for item in rain_list:
        name_list.append(item.province[0:2] + '\n' + item.city_name)
        num_list.append(item.rain24h)
    index = [i+0.25 for i in range(0,len(num_list))]
    rects=plt.bar(index, num_list, color='rgby',width = 0.5)
    plt.xticks([i+0.25 for i in index], name_list, fontproperties = font)
    plt.ylim(ymax=(int(max(num_list)+100)/100)*100, ymin=0)
    plt.xlabel("城市",fontproperties = font)
    plt.ylabel("雨量",fontproperties = font)
    plt.title("过去24小时累计降雨量全国前20名",fontproperties = font)
    for rect in rects:
        height = rect.get_height()
        plt.text(rect.get_x() + rect.get_width() / 2, height+1, str(height), ha="center", va="bottom")
    plt.show()
    print "ending drawing the picture of passed rain"

def draw_temperature(temperature_list):
    print "begin to draw the picture of passed temperature"
    font = FontProperties(fname='ttf/simhei.ttf')
    name_list = []
    num_list = []
    date = temperature_list[0].date
    for item in temperature_list:
        name_list.append(item.province[0:2] + '\n' + item.city_name)
        num_list.append(float(item.avg_temperature))
    index = [i+0.25 for i in range(0,len(num_list))]
    rects=plt.bar(index, num_list, color='rgby',width = 0.5)
    plt.xticks([i+0.25 for i in index], name_list, fontproperties = font)
    plt.ylim(ymax = math.ceil(float(max(num_list))), ymin = 0)
    plt.xlabel("城市",fontproperties = font)
    plt.ylabel("日平均气温",fontproperties = font)
    plt.title(date + "全国日平均气温最低前10名",fontproperties = font)
    for rect in rects:
        height = rect.get_height()
        plt.text(rect.get_x() + rect.get_width() / 2, height+0.1, str(height), ha="center", va="bottom")
    plt.show()
    print "ending drawing the picture of passed temperature"