【版权声明】版权所有,严禁转载,严禁用于商业用途,侵权必究。
作者:厦门大学信息学院2021级研究生 黄书滨
基于Scala语言的Spark数据处理分析案例
案例制作:厦门大学数据库实验室
指导老师:厦门大学信息学院计算机系数据库实验室 林子雨 博士/副教授 E-mail: ziyulin@xmu.edu.cn
相关教材:林子雨,赖永炫,陶继平《Spark编程基础(Scala版)》(访问教材官网)
【查看基于Scala语言的Spark数据分析案例集锦】
一、实验环境
- 系统:Ubuntu 22.04(VMware)
- 编程语言:Scala 2.12.15,Python 3.10
- Java环境:JDK 1.8
- 框架:Spark-3.2.0,Hadoop-3.1.3,sbt-1.4.3
- Python包:numpy,pandas,matplotlib
- 开发工具:Idea-2020.3,Anaconda Jupyter Notebook
二、实验准备
1.数据集说明
本次实验采用Kaggle上经典的泰坦尼克号生还数据集,可以直接从百度网盘下载(提取码:ziyu),使用其训练集train.csv作为我们分析的对象(这里将train.csv重命名为titanic.csv),该数据集包含891位乘客的个人信息数据,数据包含以下字段:
• PassengerId : 乘客编号。
• Survived : 是否存活,0表示未能存活,1表示存活。
• Pclass : 描述乘客所属的等级,总共分为三等,用1、2、3来描述:1表示高等;2表示中等;3表示低等。
• Name : 乘客姓名。
• Sex : 乘客性别。
• Age : 乘客年龄。
• SibSp : 与乘客同行的兄弟姐妹(Siblings)和配偶(Spouse)数目。
• Parch : 与乘客同行的家长(Parents)和孩子(Children)数目。
• Ticket : 乘客登船所使用的船票编号。
• Fare : 乘客上船的花费。
• Cabin : 乘客所住的船舱。
• Embarked : 乘客上船时的港口,C表示Cherbourg;Q表示Queenstown;S表示Southampton。
2.将数据集存放在分布式文件系统HDFS中
• 打开linux终端启动Hadoop中的HDFS组件,在命令行运行下面命令:
cd /usr/local/hadoop
./sbin/start-dfs.sh
• 在hadoop上登录用户创建目录,在命令行运行下面命令:
hdfs dfs -mkdir -p /user/hadoop• 把本地文件系统中的数据集titanic.csv上传到分布式文件系统HDFS中:
./bin/hdfs dfs -put ~/下载/titanic.csv /user/hadoop3.创建Idea工程
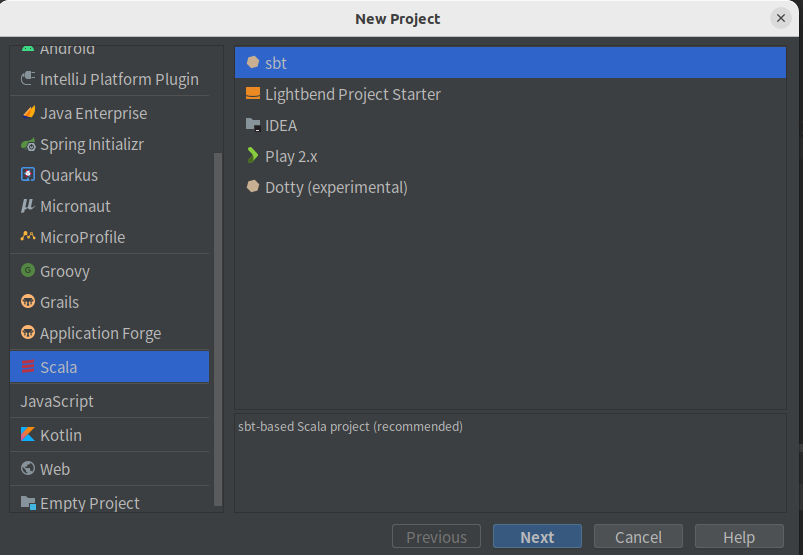
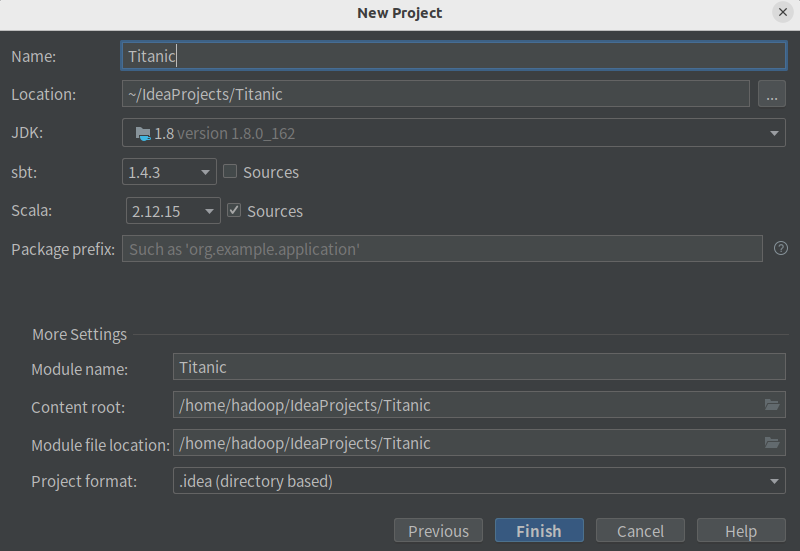
• 选择新建项目,并创建sbt项目,如下:
• 修改目录下的build.sbt文件为如下:
name := "Titanic"
version := "1.0"
scalaVersion := "2.12.15"
libraryDependencies += "org.apache.spark" %% "spark-core" % "3.2.0"
libraryDependencies += "org.apache.spark" %% "spark-sql" % "3.2.0"
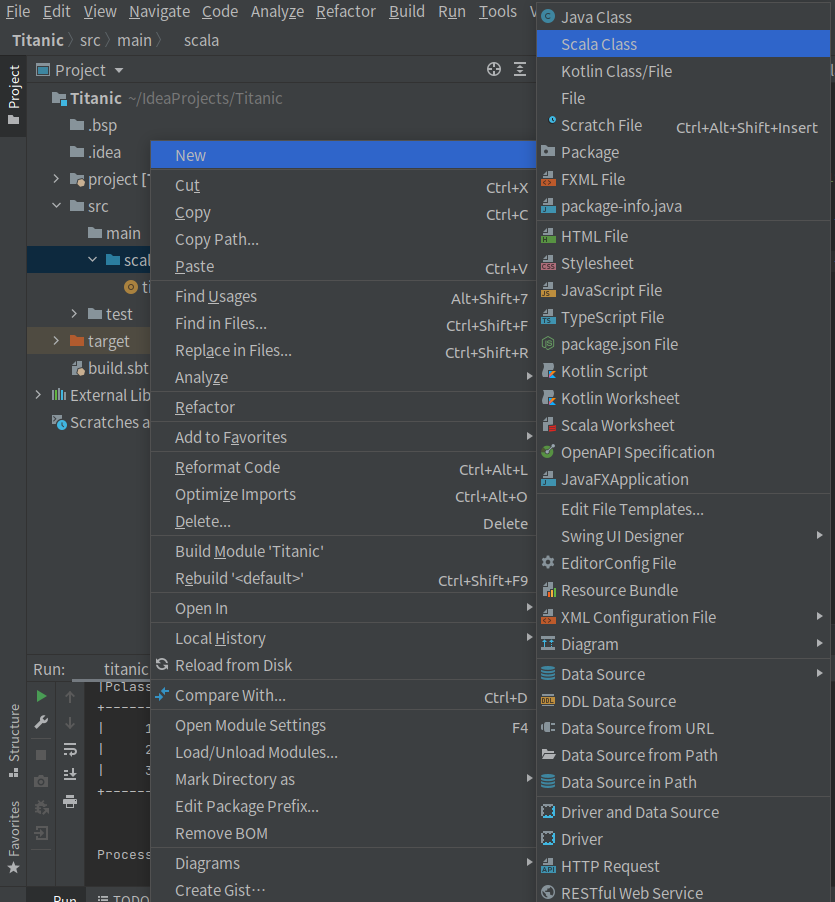
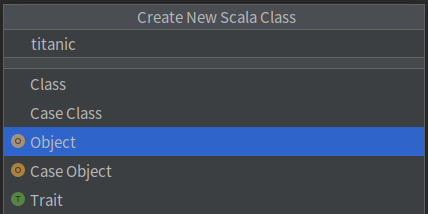
• 在/src/main/scala上单击鼠标右键,在弹出的菜单中选择New,再在弹出的菜单中选择Scala Class,然后,在弹出的界面中,输入类的名称titanic,类型选择Object,然后回车,就可以创建一个空的代码文件titanic.scala。
三、Spark数据预处理
1.读取HDFS并转换为DataFrame
• 由于读入的文件是csv文件,为结构化的数据,因此我们使用SparkSQL读取数据,并转换成DataFrame形式,以方便后续实验的分析。
val conf = new SparkConf().setAppName("Titanic").setMaster("local[2]")
val sc = new SparkContext(conf)
val spark = org.apache.spark.sql.SparkSession.builder
          .master("local")
        .appName("Titanic")
          .getOrCreate;
val df = spark.read
          .format("csv")
      .option("header", "true")
        .option("mode", "DROPMALFORMED")
     .load("hdfs://localhost:9000/user/hadoop/titanic.csv")
import spark.implicits._
2.修改字段的数据类型
• 这里DataFrame中字段的数据类型都是StringType,我们需要根据特定字段来修改其对应的数据类型。
df.withColumn("Pclass",df("Pclass").cast(IntegerType))
      .withColumn("Survived",df("Survived").cast(IntegerType))
      .withColumn("Age",df("Age").cast(DoubleType))
      .withColumn("SibSp",df("SibSp").cast(IntegerType))
      .withColumn("Parch",df("Parch").cast(IntegerType))
.withColumn("Fare",df("Fare").cast(DoubleType))-
- 删除不必要字段
• 数据集中PassengerId,Name,Ticket字段存在唯一性,三个属性意义不大,同时Cabin字段缺失值非常多,所以这四个字段不加入后续的分析:Val df1=df.drop("PassengerId").drop("Name").drop("Ticket").drop("Cabin")4.缺失值处理
• 统计数据集中每个字段的缺失值:val columns=df1.columns val missing_cnt=columns.map(x=>df1.select(col(x)).where(col(x).isNull).count) val result_cnt=sc.parallelize(missing_cnt.zip(columns)).toDF("missing_cnt","column_name") result_cnt.show()
• 我们观察到Age字段和Embarked字段分别存在177和2个缺失值,这里使用Age字段中所有非null的平均值来填充缺失值,使用'S'来填充Embarked字段的缺失值。def meanAge(dataFrame: DataFrame): Double = { dataFrame .select("Age") .na.drop() .agg(round(mean("Age"), 0)) .first() .getDouble(0) }
- 删除不必要字段
val df2= df1
.na.fill(Map(
"Age" -> meanAge(df1),
"Embarked" -> "S"))
• 至此,数据预处理完成,df2即为预处理好后的DataFrame。
# 四、使用 Spark进行数据分析
1.891人当中,共多少人生还?
按是否存活(0/1)分组,将输出结果写入本地文件。
```scala
val survived_count=df2.groupBy("Survived").count()
survived_count.show()
survived_count.coalesce(1).write.option("header", "true").csv("/home/hadoop/titanic_output/survived_count.csv")
2.不同上船港口生还情况
按上船港口以及是否存活分组计数,得到每个分组的计数,将输出结果写入本地文件。
val survived_embark=df2.groupBy("Embarked","Survived").count()
survived_embark.show()
survived_embark.coalesce(1).write.option("header", "true").csv("/home/hadoop/titanic_output/survived_embark.csv")
3.存活/未存活的男女数量及比例
val survived_sex_count=df2.groupBy("Sex","Survived").count()
val survived_sex_percent=survived_sex_count.withColumn("percent",format_number(col("count").divide(sum("count").over()).multiply(100),5));
survived_sex_percent.show()
survived_sex_percent.coalesce(1).write.option("header", "true").csv("/home/hadoop/titanic_output/survived_sex_percent.csv")
按男女性别以及是否存活分组计数,并除以总乘客数,得到每个分组的占比,将输出结果写入本地文件。
4.不同级别乘客生还人数和占总生还人数的比例
val survived_df = df2.filter(col("Survived")===1)
val pclass_survived_count=survived_df.groupBy("Pclass").count()
val pclass_survived_percent=pclass_survived_count.withColumn("percent",format_number(col("count").divide(sum("count").over()).multiply(100),5));
pclass_survived_percent.show()
pclass_survived_percent.coalesce(1).write.option("header", "true").csv("/home/hadoop/titanic_output/pclass_survived_percent.csv")
首先筛选出存活下来的乘客信息,接着按照乘客级别分组计数,然后将低级、中级、高级的人数除以总的生还人数得到比例,将输出结果写入本地文件。
5.有无同行父母/孩子的生还情况
val df4=df2.withColumn("Parch_label",when(df2("Parch")>0,1).otherwise(0))
val parch_survived_count=df4.groupBy("Parch_label","Survived").count()
parch_survived_count.show()
parch_survived_count.coalesce(1).write.option("header", "true").csv("/home/hadoop/titanic_output/parch_survived_count.csv")
加上一个Parch_label标签,如果Parch大于0则为1(有同行父母孩子),等于0则为0(无同行父母孩子)。然后根据Parch_label和是否存活分组计数,将输出结果写入本地文件。
6.按照年龄,将乘客划分为未成年人、青年人、中年人和老年人,分析四个群体生还情况
val df3=survived_df.withColumn("Age_label",when(df2("Age")<=18,"minor").when(df2("Age")>18 && df2("Age")<=35,"young").when(df2("Age")>35 && df2("Age")<=55,"middle").otherwise("older"))
val age_survived=df3.groupBy("Age_label","Survived").count()
age_survived.show()
age_survived.coalesce(1).write.option("header", "true").csv("/home/hadoop/titanic_output/age_survived.csv")
根据(3)中获得的存活乘客信息,加上一个Age_label标签,将Age中小于等于18岁的归为minor,大于18岁小于等于35岁的归为young,大于35岁小于等于55岁的归为middle,大于55岁的归为older。再根据Age_label去分组计数,将输出结果写入本地文件。
7.提取乘客等级和上船费用信息
val sef = Seq("Pclass", "Fare")
val df5 = df2.select(sef.head, sef.tail: _*)
df5.show(5)
df5.coalesce(1).write.option("header", "true").csv("/home/hadoop/titanic_output/pclass_fare.csv")
为提取的信息目标构建表头,然后根据这个表头的属性在DataFrame中筛选列,将输出结果写入本地文件。
五、 实验结果可视化
• 实验结果的可视化采用python语言,在jupyter notebook平台上运行,可视化库采用matplotlib库,同时结合pandas库、numpy库。
• 先导入需要用到的三个库:
import pandas as pd
import matplotlib.pyplot as plt
import numpy as np
1.生还情况可视化
survived_count=pd.read_csv("/home/hadoop/titanic_output/survived_count.csv",dtype = {'Survived' : str})
survived_count
plt.title('Survival Count')
survived=survived_count['Survived']
count_number=survived_count['count']
bar=plt.bar(survived,count_number,width = 0.2)
bar[0].set_color('b')
bar[1].set_color('g')
plt.xlabel('Survived')
plt.ylabel("count_number")
for a, b in zip(survived, count_number):
 plt.text(a, b, '%.0f' % b, ha='center', va='bottom', fontsize=8)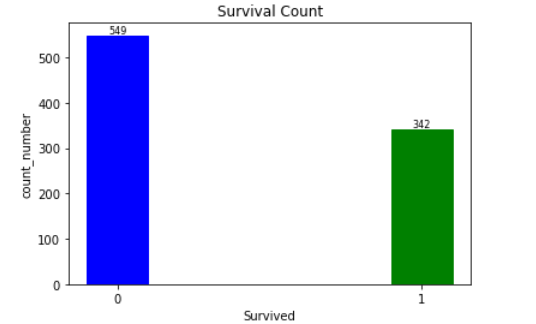
• 可以得知891名乘客中只有342名乘客幸存,其余549名乘客遇难丧生。
2.登船港口生存情况
survived_embark=pd.read_csv("/home/hadoop/titanic_output/survived_embark.csv",dtype = {'Survived' : str})
survived_embark

x=np.array(['0','1'])
C=survived_embark[survived_embark['Embarked']=='C']['count']
S=survived_embark[survived_embark['Embarked']=='S']['count']
Q=survived_embark[survived_embark['Embarked']=='Q']['count']

plt.bar(x,C,label='Cherbourg',width=0.2)
plt.bar(x,S,bottom=C,label='Southampton',width=0.2)
plt.bar(x,Q,bottom=S.reset_index()['count']+C.reset_index()['count'],label='Queenstown',width=0.2)
plt.legend()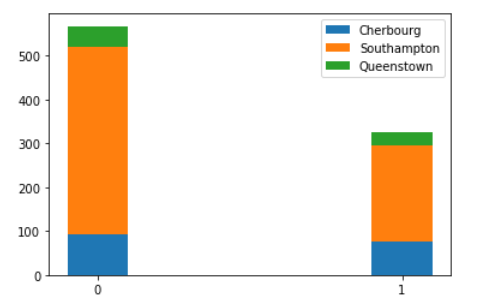
• 从堆叠图中看到在南安普顿港口登船的死亡人数最多,在瑟堡登船的人存活下来的比例大,而在皇后镇登船的人较少。
3.男女性的存活情况
survived_sex_percent=pd.read_csv("/home/hadoop/titanic_output/survived_sex_percent.csv")
survived_sex_percent.set_index(['Sex','Survived'])
from matplotlib import cm
count=survived_sex_percent['count']
colors = cm.GnBu(np.arange(len(count)) / len(count))
plt.figure(figsize= (5,5))
explode = (0, 0.2, 0, 0)
plt.pie(survived_sex_percent['count'],explode=explode,autopct="%2.2f%%",colors=colors,startangle=90,labels=['female_unsurvived','female_survived','male_survived','male_unsurvived'])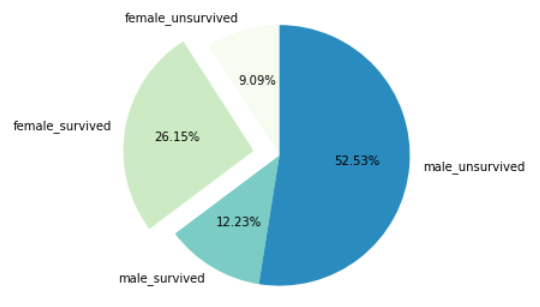
• 从饼图中看到在泰坦尼克事故中,男性大部分未能存活,女性中有四分之三左右的人数得以幸存,这跟与电影中的情节一致:船上男人们让妇女儿童先逃生。
4.不同等级乘客生还情况
pclass_survived_percent=pd.read_csv("/home/hadoop/titanic_output/pclass_survived_percent.csv",dtype = {'Pclass' : str})
pclass_survived_percent
survived_number=pclass_survived_percent['count']
pclass=pclass_survived_percent['Pclass']

plt.figure(figsize= (12 ,6))
plt.subplot(121)
bar=plt.bar(pclass,survived_number,width = 0.2)
bar[0].set_color('r')
bar[1].set_color('g')
bar[2].set_color('b')
plt.xlabel('Pclass')
plt.ylabel("survived_number")
for a, b in zip(pclass, survived_number):
 plt.text(a, b, '%.0f' % b, ha='center', va='bottom', fontsize=8)
plt.subplot(122)
plt.pie(survived_number,labels=pclass,autopct="%2.2f%%")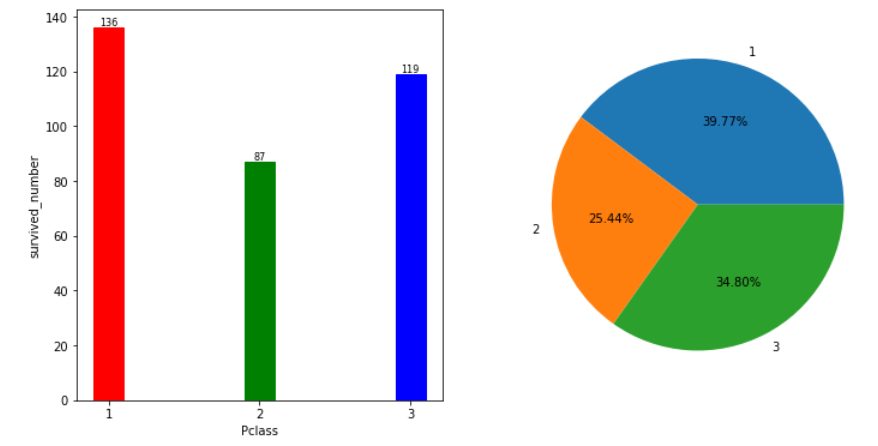
• 从柱状图和饼图来看,高级乘客占存活人数的比例最大,但同时也看到低级乘客占存活人数的人数和比例接近高级乘客。
5.有无同行父母孩子的存活情况
parch_survived_count=pd.read_csv("/home/hadoop/titanic_output/parch_survived_count.csv",dtype = {'Survived' : str,'Parch_label' : str})
parch_survived_count

plt.figure(figsize= (14 ,6))
plt.subplot(121)
label=['parch_unsurvived','no_parch_survived','no_parch_unsurvived','parch_survived']
number=parch_survived_count['count']
y=[1,2,3,4]
plt.barh(y,number,facecolor='tan',height=0.5,edgecolor='r',alpha=0.6,tick_label=label)
plt.subplot(122)
x=np.array(['0','1'])
parch=parch_survived_count[parch_survived_count['Parch_label']=='1']['count']
no_parch=parch_survived_count[parch_survived_count['Parch_label']=='0']['count']
plt.bar(x,parch,label='Parch',width=0.2)
plt.bar(x,no_parch,bottom=parch,label='no_Parch',width=0.2)
plt.legend()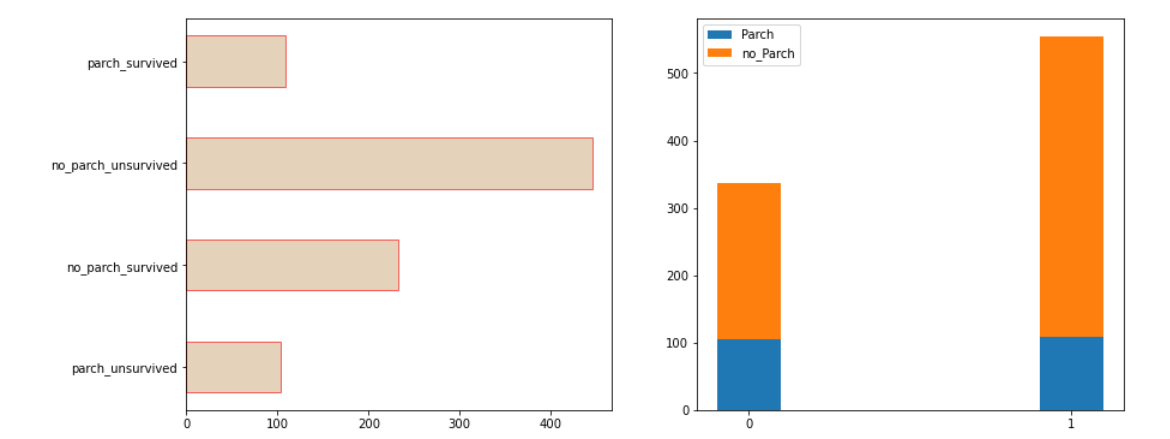
• 没有同行父母孩子的存活人数多,同时看到有同行父母孩子的存活和未存活人数差不多,猜测可能是为了救自己的亲人取舍丧生。
6.不同年龄群体的存活情况
age_survived=pd.read_csv("/home/hadoop/titanic_output/age_survived.csv",dtype = {'Survived' : str})
age_survived

plt.figure(figsize= (14 ,6))
plt.subplot(121)
bar=plt.bar(age_survived['Age_label'],age_survived['count'],width = 0.3)
bar[0].set_color('r')
bar[1].set_color('b')
bar[2].set_color('g')
bar[3].set_color('orange')
plt.xlabel('Age_label')
plt.ylabel("survived_number")
for a, b in zip(age_survived['Age_label'], age_survived['count']):
 plt.text(a, b, '%.0f' % b, ha='center', va='bottom', fontsize=8)
plt.subplot(122)
age=age_survived['Age_label']
number=age_survived['count']
plt.scatter(age, number, s=number*8,marker='o',c=[1,2,3,4])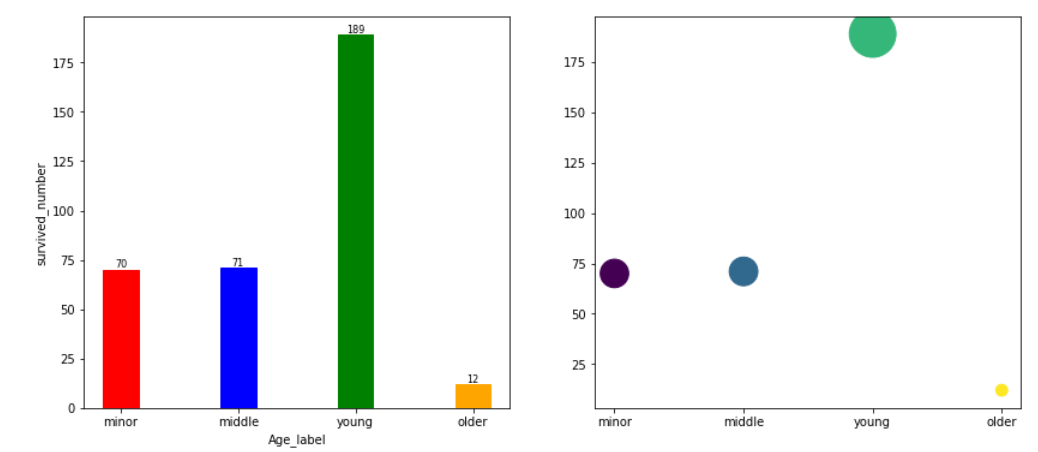
• 存活人数最多的是18-35岁的年轻人,猜测可能是他们体力较好,活下来的希望大;其次是未成年人和中年人,老年人可能因为年老和体力等原因丧生较多。
7.不同等级乘客的上船费用
pclass_fare=pd.read_csv("/home/hadoop/titanic_output/pclass_fare.csv",dtype = {'Pclass' : str})
pclass_1=pclass_fare[pclass_fare['Pclass']=='1']['Fare']
pclass_2=pclass_fare[pclass_fare['Pclass']=='2']['Fare']
pclass_3=pclass_fare[pclass_fare['Pclass']=='3']['Fare']
data_to_plot=[pclass_1,pclass_2,pclass_3]

fig = plt.figure(figsize=(12,8))
plt.violinplot(data_to_plot,showmeans=True,showmedians=False)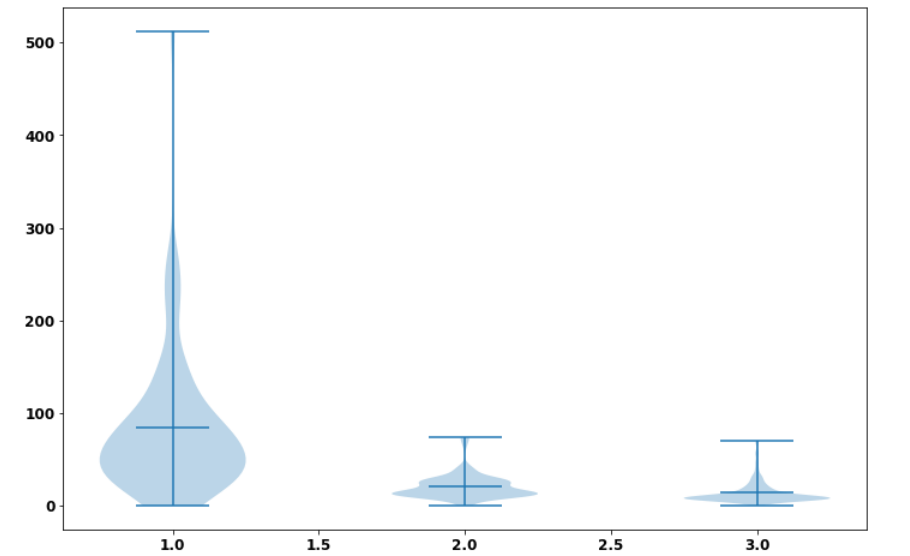
• 从提琴图可以看到,高级乘客的平均上船费用比中级、低级用户的最高消费都高,且高级乘客甚至还有消费到500+的人,从这说明高级乘客可能比较富裕且地位高。
