【版权声明】版权所有,严禁转载,严禁用于商业用途,侵权必究。
本案例由厦门大学计算机系2020级研究生龚国文同学制作,这里对他表示衷心的感谢!
相关教材:林子雨、陶继平编著《Flink编程基础(Scala版)》(官网)
相关案例:基于Scala语言的Flink数据处理分析案例集锦
本实验针对全球重大地震数据进行分析,使用scala语言进行flink编程来处理数据,最后结果使用python进行可视化
本实验涉及到的所有数据集和代码,可以从百度网盘下载。提取码:ziyu。
一、 实验环境搭建
1.操作系统:Windows10
2.scala:2.12.12

3.flink:1.11.2
4.python:3.8.8

5.运行环境:
- 数据处理:IDEA => flink编程;
- 可视化:命令行运行.py文件
6.安装可视化需要的包:
(1)pip install matplotlib
(2)下面是可视化第三部分额外用到的包:
pip install geos;
在下方链接中下载pyproj:
https://www.lfd.uci.edu/~gohlke/pythonlibs/#pyproj
找到对应python版本的下载:

在下方链接中下载basemap:
https://www.lfd.uci.edu/~gohlke/pythonlibs/#basemap
找到对应python版本的下载:
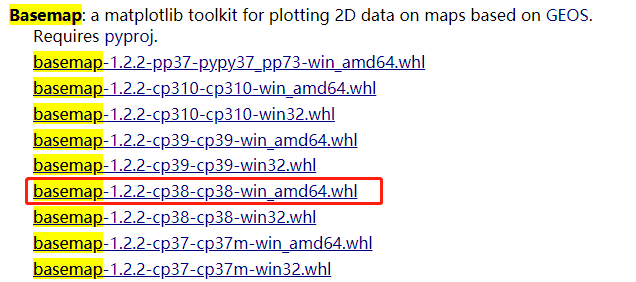
进入下载保存的pyproj和basemap的路径,运行“pip install 包名” 命令进行安装:


二、数据准备
参考往年作业:基于Spark的地震数据处理与分析
数据来自和鲸社区的1965-2016全球重大地震数据,文件名为earthquake.csv包括23412条地震数据,数据中各个字段为:Date, Time, Latitude, Longitude, Type, Depth, Magnitude,分别表示
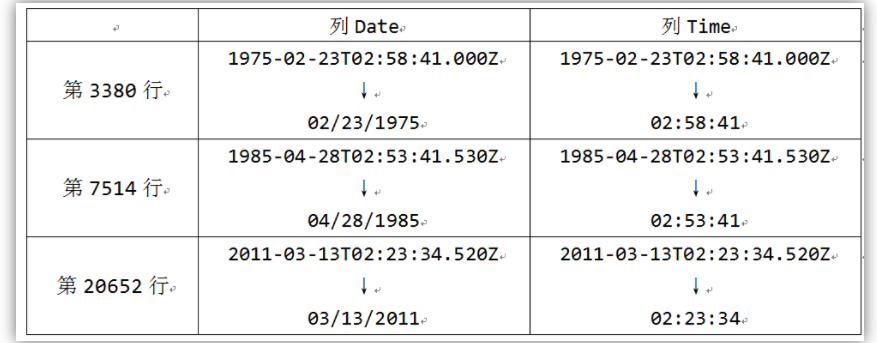
日期,时间,维度,精度,类型,深度,地震等级。数据集中有三行数据有问题,参照往年作业进行了修改:
三、数据处理
1.IDEA中创建项目
参考教程 第4章 Flink环境搭建和使用方法 中的4.3.4节:使用IntelliJ IDEA开发Flink应用程序,链接:
http://dblab.xmu.edu.cn/wp-content/uploads/2021/01/Chapter4-%E5%8E%A6%E9%97%A8%E5%A4%A7%E5%AD%A6-%E6%9E%97%E5%AD%90%E9%9B%A8-Flink%E7%BC%96%E7%A8%8B%E5%9F%BA%E7%A1%80Scala%E7%89%88-%E7%AC%AC4%E7%AB%A0-Flink%E7%8E%AF%E5%A2%83%E6%90%AD%E5%BB%BA%E5%92%8C%E4%BD%BF%E7%94%A8%E6%96%B9%E6%B3%95%EF%BC%882021%E5%B9%B43%E6%9C%88%E7%89%88%E6%9C%AC%EF%BC%89.pdf
2.代码
pom.xml文件和源码已和本实验报告一起打包发送。
代码如下(代码每个部分的含义已在注释中给出):
package cn.edu.xmu.dblab
import org.apache.flink.api.scala.ExecutionEnvironment
import org.apache.flink.api.common.operators.Order
import org.apache.flink.api.scala._

object EarthQuakes {
  def main(args: Array[String]): Unit = {
    //第1步:建立执行环境
    val env = ExecutionEnvironment.getExecutionEnvironment
    //第2步:指定数据文件路径
    val filePath="file:///earthquake.csv"
    //第3步:读取数据
    val csv = env.readCsvFile[EarthQuakesLog](filePath,ignoreFirstLine = true)
    //第3步:对数据集指定转换操作
    //每条数据映射到(年份, 1)
    val yearMap : DataSet[(String,Int)] = csv.map(x=>x.Date).map(yearSplit(_))
    //对每年地震数量统计
    val yearCount = yearMap.groupBy(0).sum(1)

    //每条数据映射到(月份, 年份, 1)
    val monthMap : DataSet[(String,String,Int)] = csv.map(x=>x.Date).map(monthSplit(_))
    //对分组(月份, 年份)统计数量
    val monthCount = monthMap.groupBy(0,1).sum(2)

    //取出(纬度, 经度, 地震等级)
    val location : DataSet[(Double,Double,Double)] = csv.map(x=>(x.Latitude,x.Longitude,x.Magnitude))

    // 第4步:输出结果
    yearCount.writeAsCsv("file:///yearCount")
    monthCount.writeAsCsv("file:///monthCount")
    location.writeAsCsv("file:///location")
    env.execute()
  }
  case class
  EarthQuakesLog(Date:String, Time:String, Latitude:Double, Longitude:Double,
                 Type:String, Depth:Double, Magnitude:Double)

  def yearSplit(x:String) : (String,Int) = {
    val strs = x.split("/")
    return (strs(2),1)
  }
  def monthSplit(x:String) : (String,String,Int) = {
    val strs = x.split("/")
    return (strs(0),strs(2),1)
  }

}
实际的数据文件earthquake.csv的路径以及分析之后的输出路径可修改为需要的路径。
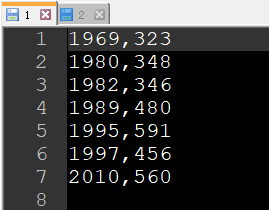
分析结果写入本地之后,实际上将结果保存为了多个文件:

每个文件保存了部分结果:
四、可视化
使用python进行可视化,.py文件已和本实验报告一起打包发送
使用时需要修改需要读取的数据文件实际的保存路径:

1.全球每年发生重大地震的次数
可视化代码:
import os
import matplotlib.pyplot as plt

def file_name(path):
    for root,dirs,files in os.walk(path):
        pass
    return files

def readData(file_path,yearcounts):
    f=open(file_path,'r')
    for term in f:
        #print(term)
        term=term.strip('\n')
        temp=term.split(',')
        yearcounts.append((int(temp[0]),int(temp[1])))
    f.close()

path="D:\\yearCount"
files=file_name(path)

years=[]
counts=[]
yearcounts=[]

#读取文件夹下所有文件
for file in files:
    file_path = path + "\\" + file
    #对每个文件, 读出其中数据
    readData(file_path,yearcounts)
#按年份进行排序 (升序)
yearcounts = sorted(yearcounts)

#画图
for year,count in yearcounts:
    years.append(year)
    counts.append(count)

plt.title('Earthquakes Per Year')
plt.xlabel('Year')
plt.ylabel('Count')
plt.plot(years,counts)
plt.show()
运行:

结果:
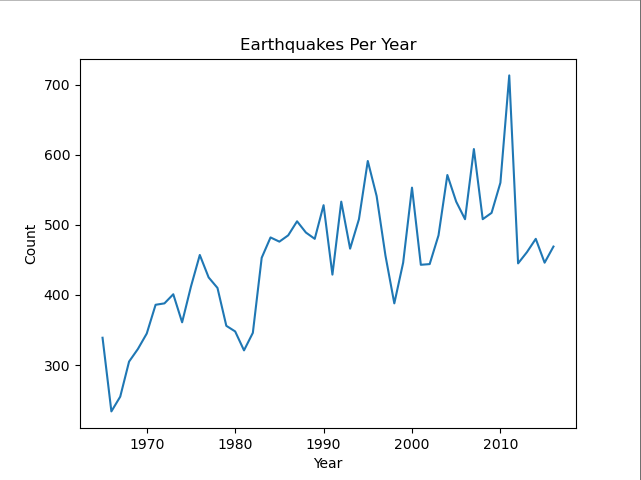
可以看到从1965年到2016每年地震次数有上升的趋势
2.全球不同年份每月发生重大地震的次数
可视化代码:
import os
import matplotlib.pyplot as plt

def file_name(path):
    for root,dirs,files in os.walk(path):
        pass
    return files

def readData(file_path,x,y):
    f=open(file_path,'r')
    for term in f:
        term=term.strip('\n')
        temp=term.split(',')
        x.append(int(temp[0]))
        y.append(int(temp[2]))
    f.close()

path="D:\\monthCount"
files=file_name(path)

month=[]
count=[]

#读取文件夹下所有文件
for file in files:
    file_path = path + "\\" + file
    #对每个文件, 读出其中数据
    readData(file_path,month,count)

#画图
plt.title('Earthquakes Per Month')
plt.xlabel('Month')
plt.ylabel('Count')
plt.scatter(month, count, alpha=0.2)
plt.show()
运行:

结果:
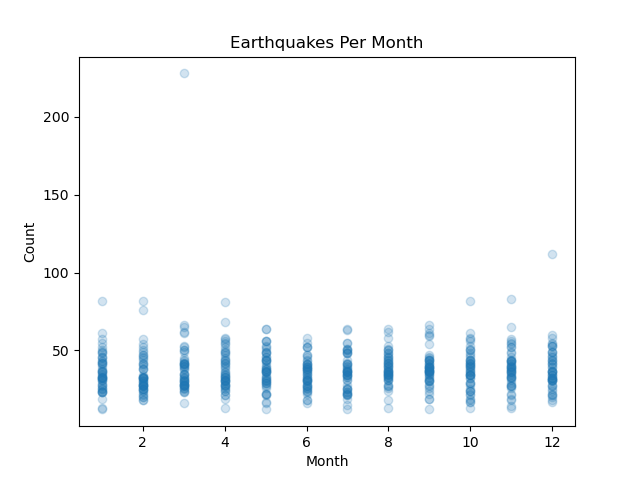
从图中可以看到每年每个月的地震次数在[10,60]这个区间
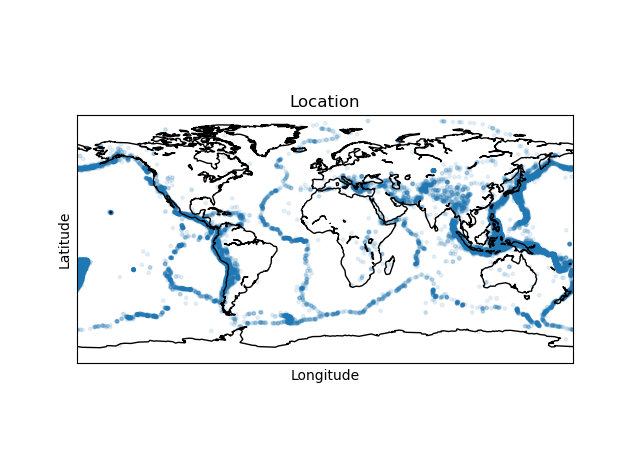
3.全球经常发生重大地震的地带
可视化代码:
import os
import matplotlib.pyplot as plt
import mpl_toolkits.basemap

def file_name(path):
    for root,dirs,files in os.walk(path):
        pass
    return files

def readData(file_path,latitudes,longitudes,magnitudes):
    f=open(file_path,'r')
    for term in f:
        #print(term)
        term=term.strip('\n')
        temp=term.split(',')
        latitudes.append(float(temp[0]))
        longitudes.append(float(temp[1]))
        magnitudes.append(float(temp[2]))
    f.close()

path="D:\\location"
files=file_name(path)

latitudes=[]
longitudes=[]
magnitudes=[]

#读取文件夹下所有文件
for file in files:
    file_path = path + "\\" + file
    #对每个文件, 读出其中数据
    readData(file_path,latitudes,longitudes,magnitudes)

#世界地图
basemap = mpl_toolkits.basemap.Basemap()
basemap.drawcoastlines()
#画图
plt.title('Location')
plt.xlabel('Longitude')
plt.ylabel('Latitude')
plt.scatter(longitudes, latitudes, alpha=0.1, s=magnitudes)
plt.show()
运行:

结果:
